AI-powered learning
Save this course
Data Visualization and Analysis With Seaborn Library
Delve into data visualization and analysis with Python's Seaborn library. Learn about variable types, data cleaning, creating detailed visualizations, and applying themes for more appealing results.
5.0
50 Lessons
12h
Updated 4 weeks ago
Join 3 million developers at
Join 3 million developers at
LEARNING OBJECTIVES
- The ability to perform data analysis using various statistical techniques
- The ability to use Pandas library for data extraction and cleaning
- The ability to use Seaborn plots for different data types
- The ability to use Seaborn’s distribution and regression plots to extract and visualize interesting trends in data
- The ability to use Seaborn's built-in themes, palettes, and grids to enhance the plot aesthetics
Learning Roadmap
2.
Introduction to Seaborn and Statistical Analysis
Introduction to Seaborn and Statistical Analysis
Look at data visualization essentials, variable types, statistical analysis, and starting with Seaborn.
3.
Plotting Numerical Data
Plotting Numerical Data
9 Lessons
9 Lessons
Examine tools to manipulate, clean, and visualize numerical data using pandas and Seaborn.
5.
Plotting the Categorical Data
Plotting the Categorical Data
8 Lessons
8 Lessons
Take a closer look at plotting categorical data using Seaborn's bar, point, box, violin, swarm, strip, and cat plots.
6.
Visualizing Distribution of Data
Visualizing Distribution of Data
7 Lessons
7 Lessons
Investigate visualizing data distributions with KDE, hist, ECDF, rug, joint, and displots in Seaborn.
7.
Visualizing Regression Models
Visualizing Regression Models
4 Lessons
4 Lessons
Build on visualizing and analyzing regression models, reg plots, and lmplots with Seaborn.
8.
Styling and Figure Aesthetics
Styling and Figure Aesthetics
6 Lessons
6 Lessons
Get familiar with figure aesthetics, Seaborn themes, scaling, styling, axis spines, and color palettes.
9.
Multiplot Grids
Multiplot Grids
6 Lessons
6 Lessons
Walk through multi-plot grids to visualize variable relationships and customize plots.
10.
Project
Project
2 Lessons
2 Lessons
Certificate of Completion
Showcase your accomplishment by sharing your certificate of completion.
Complete more lessons to unlock your certificate
Developed by MAANG Engineers
ABOUT THIS COURSE
This course aims to provide an introduction to data visualization and analysis using Python and the Seaborn library.
The course begins by introducing various variable types and statistical analysis methods. Then, you get to review the foundations of data cleaning and extraction using the pandas library. In the second half of the course, you will go over different plots in Seaborn for numerical, continuous, and categorical data, as well as distribution and regression plots to gain insightful information and identify patterns in the data. Lastly, you get to learn to create complex visualizations that are also aesthetically pleasing and go into great detail about the Seaborn themes, color palettes, styling, and multiplot grids.
By the end of this course, you’ll apply the knowledge you’ve gained with a hands-on project.
ABOUT THE AUTHOR

Mohammad Amir Asim Khan Jalwana
I am a dedicated computer scientist passionate about learning and teaching.
Trusted by 3 million developers working at companies
A
Anthony Walker
@_webarchitect_
E
Evan Dunbar
ML Engineer
S
Software Developer
Carlos Matias La Borde
S
Souvik Kundu
Front-end Developer
V
Vinay Krishnaiah
Software Developer
Built for 10x Developers
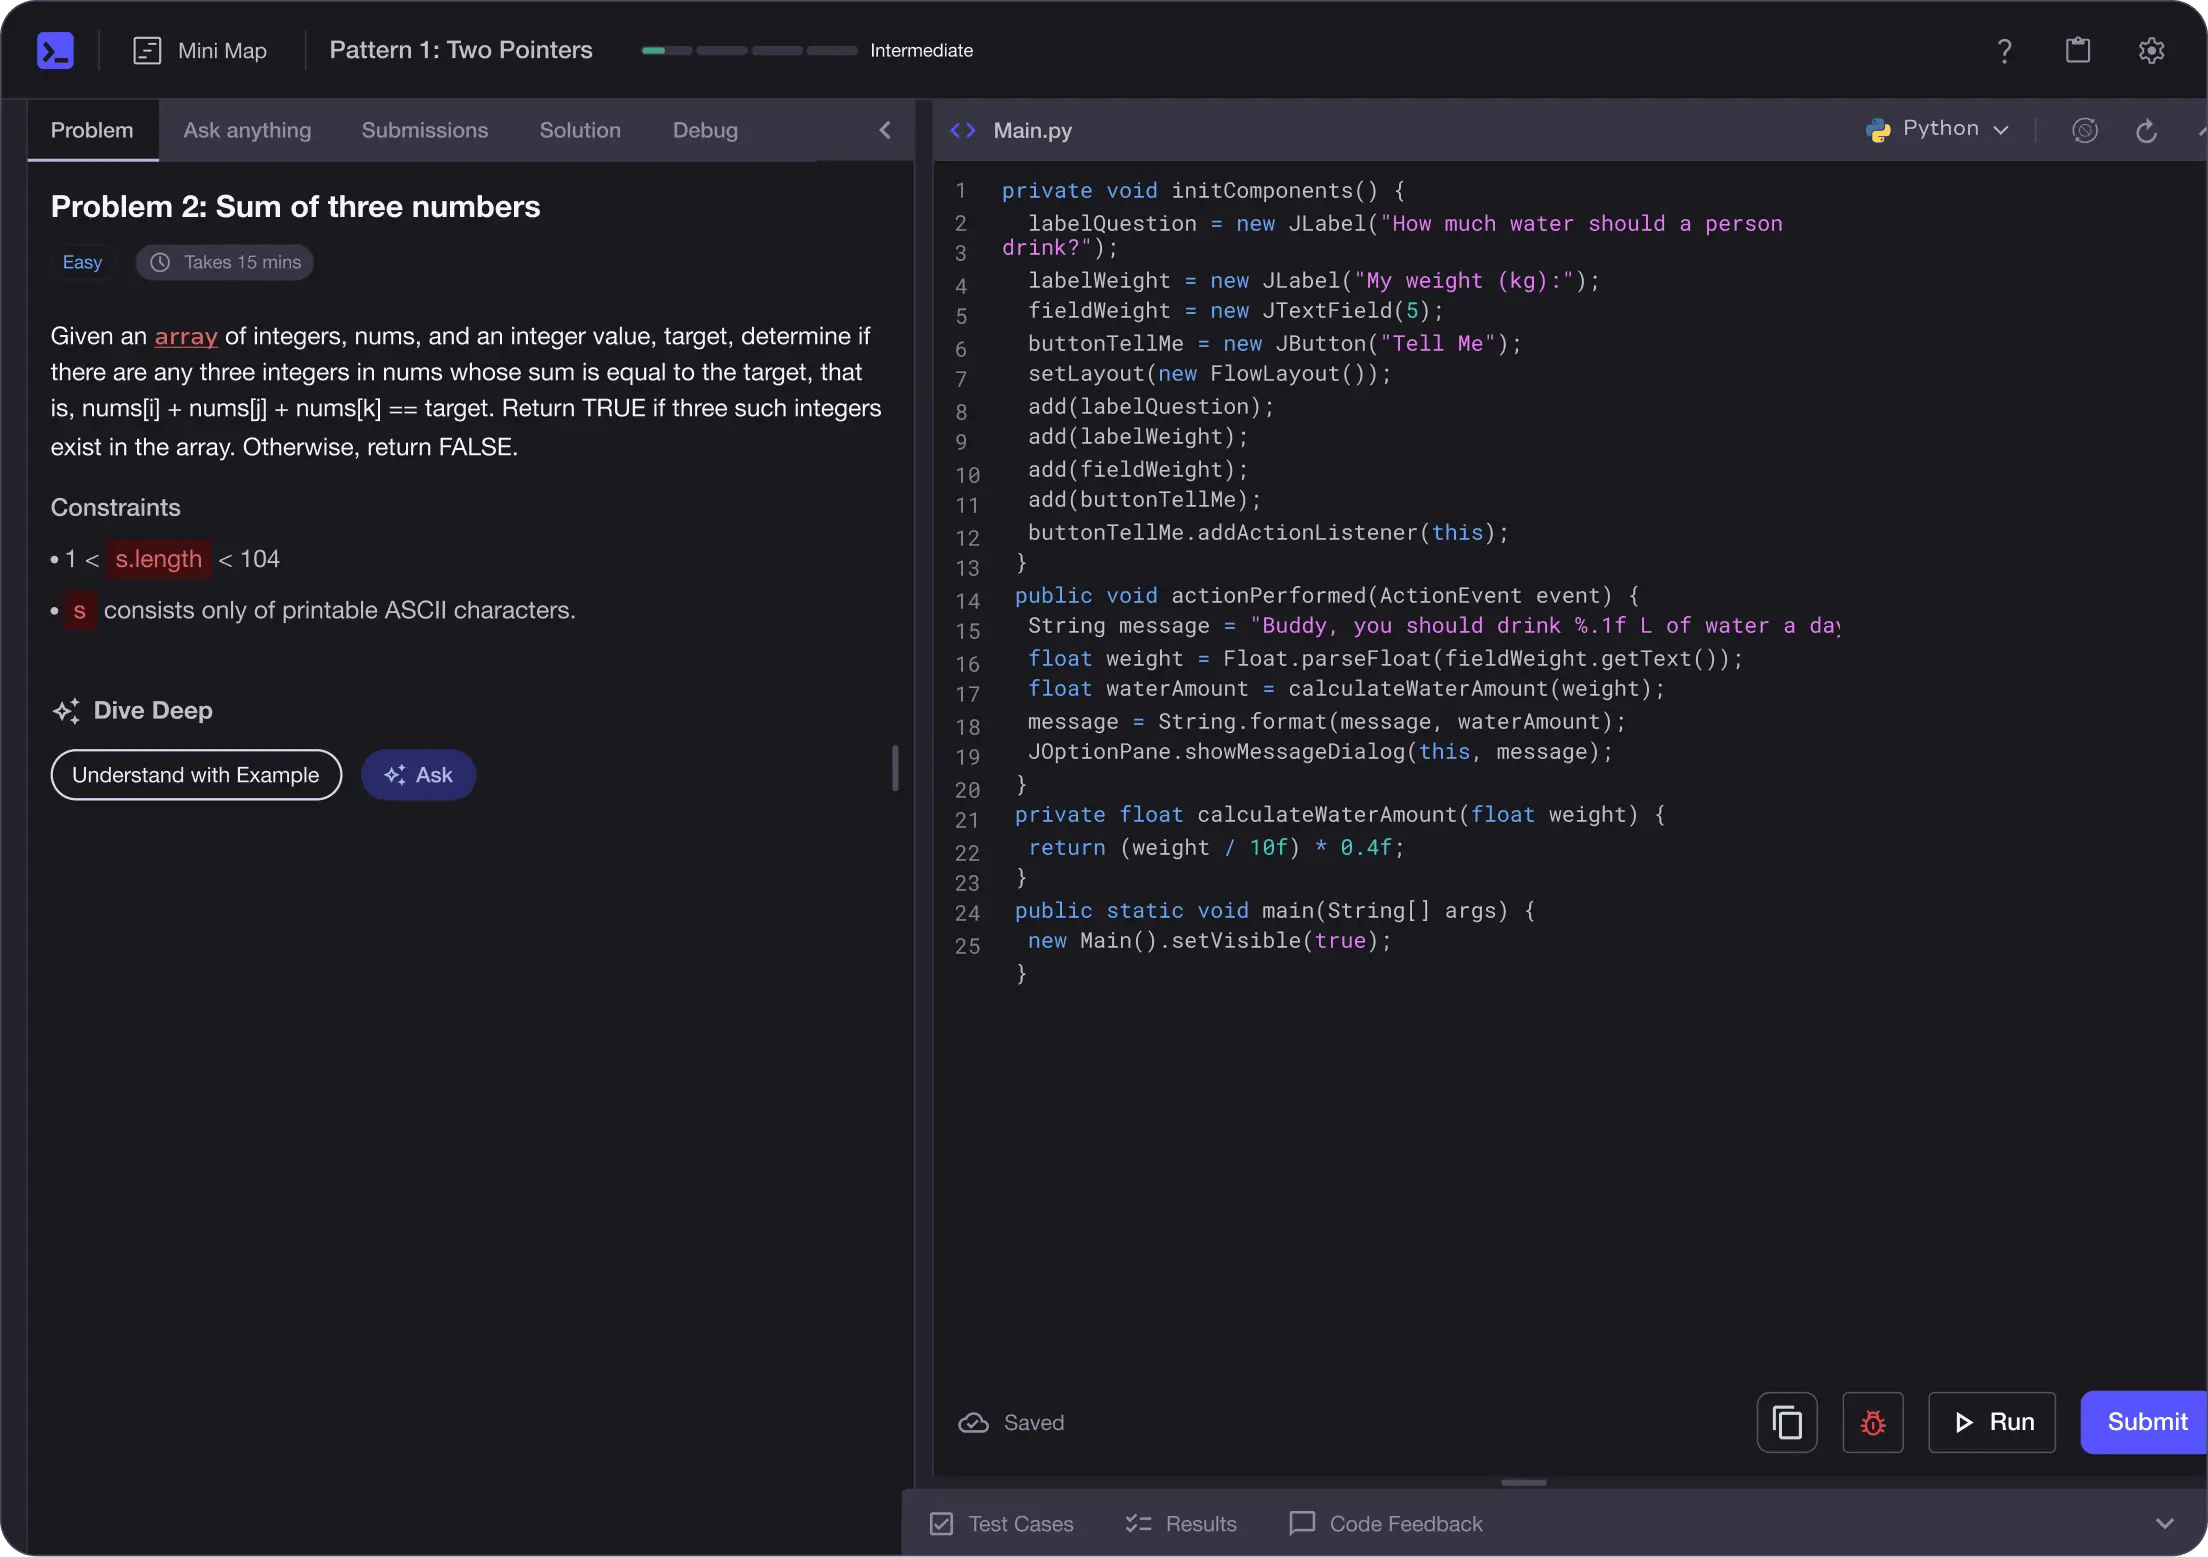
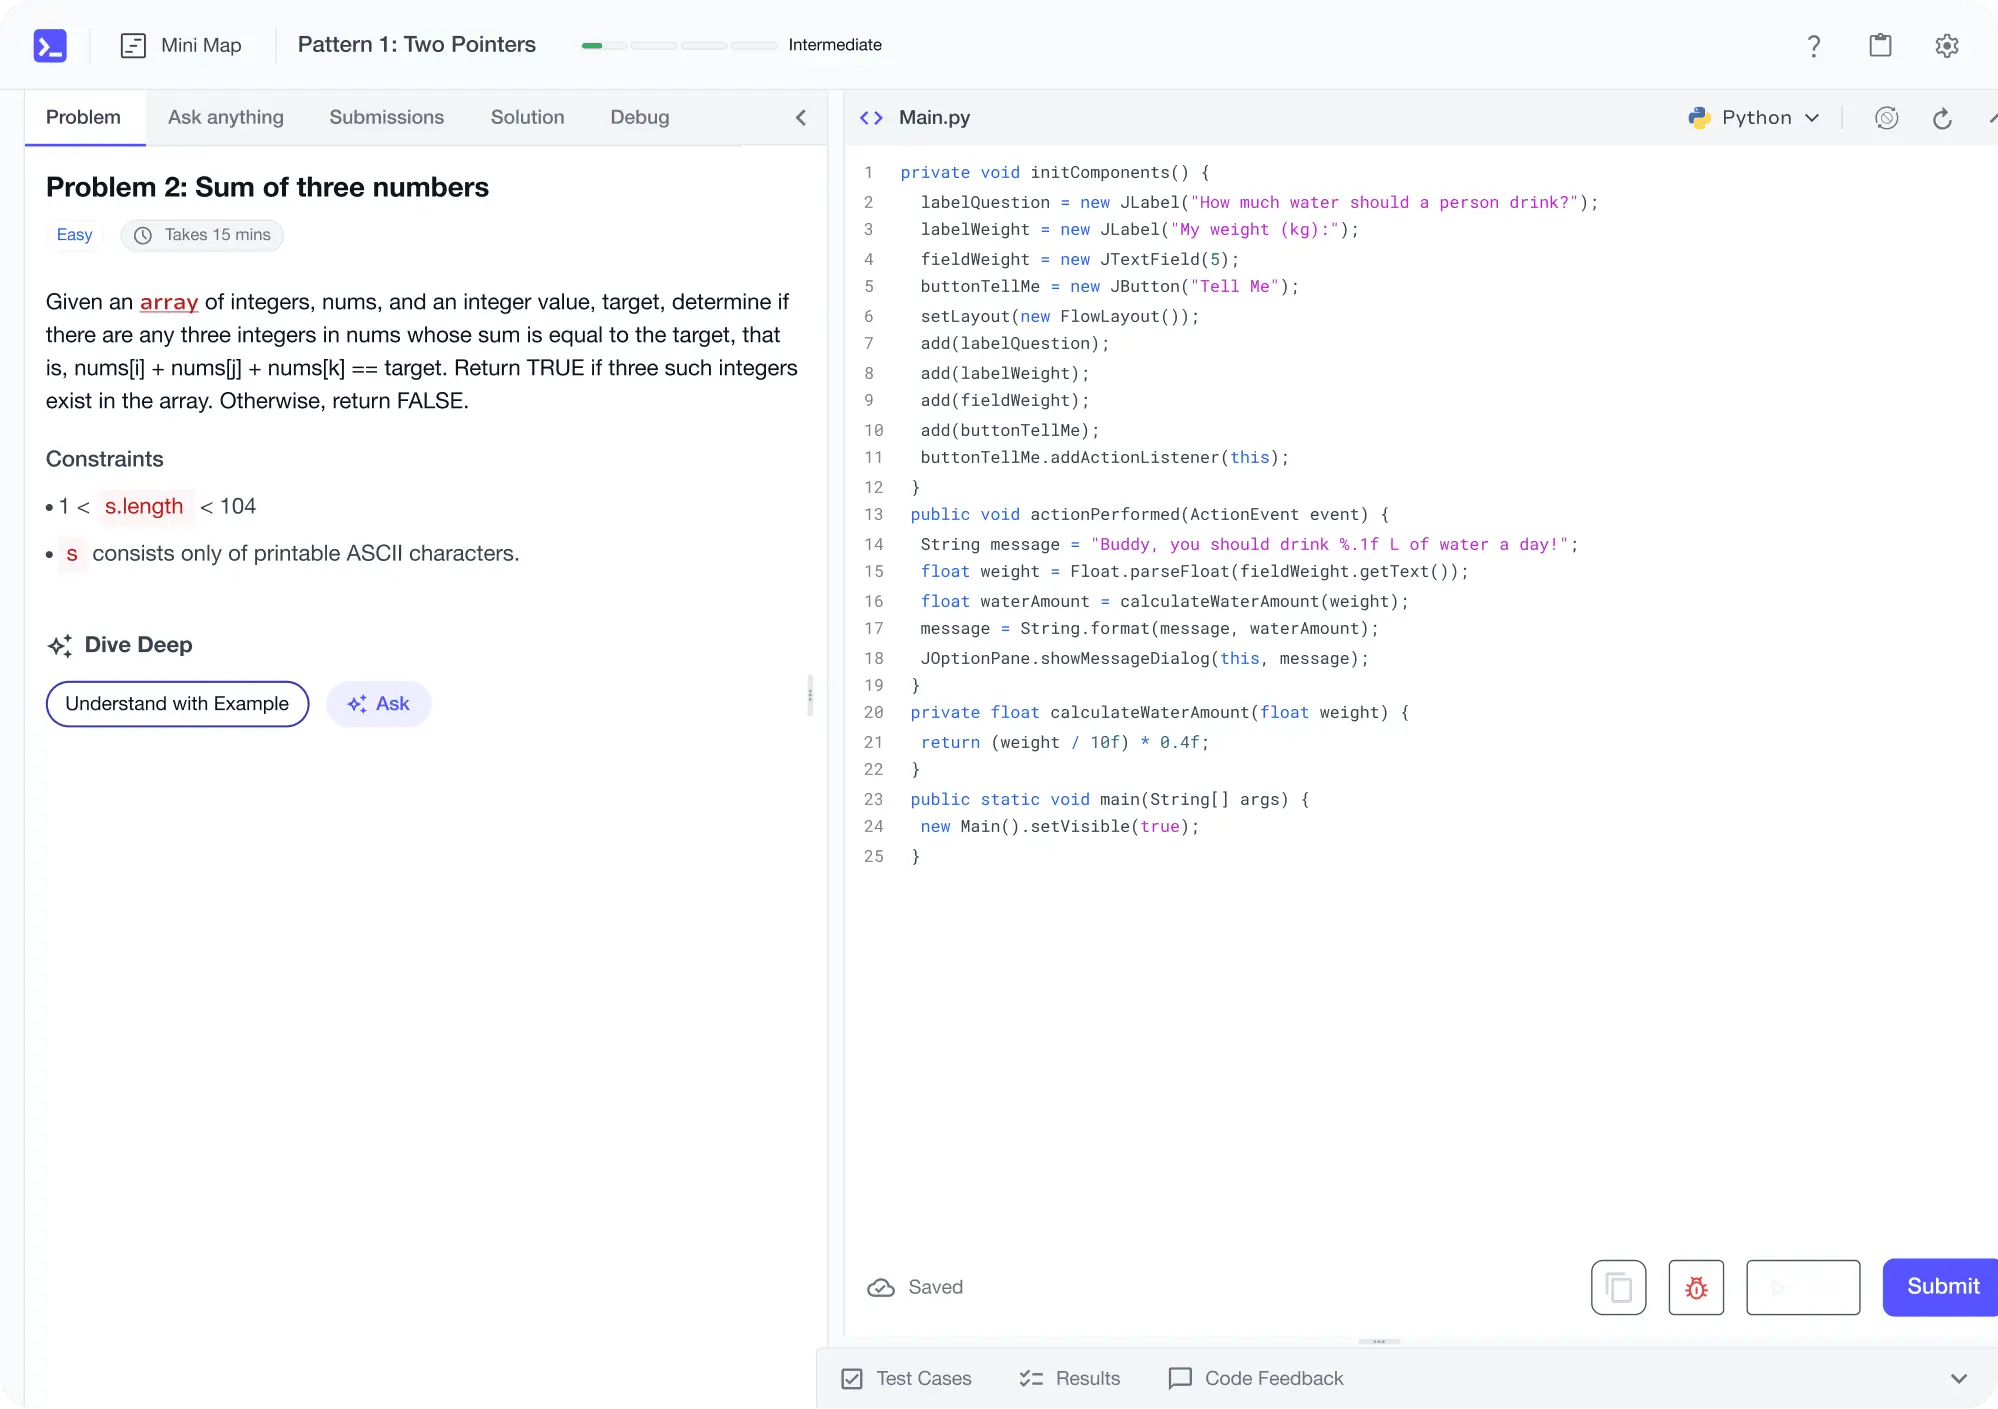
No Passive Learning
Learn by building with project-based lessons and in-browser code editor
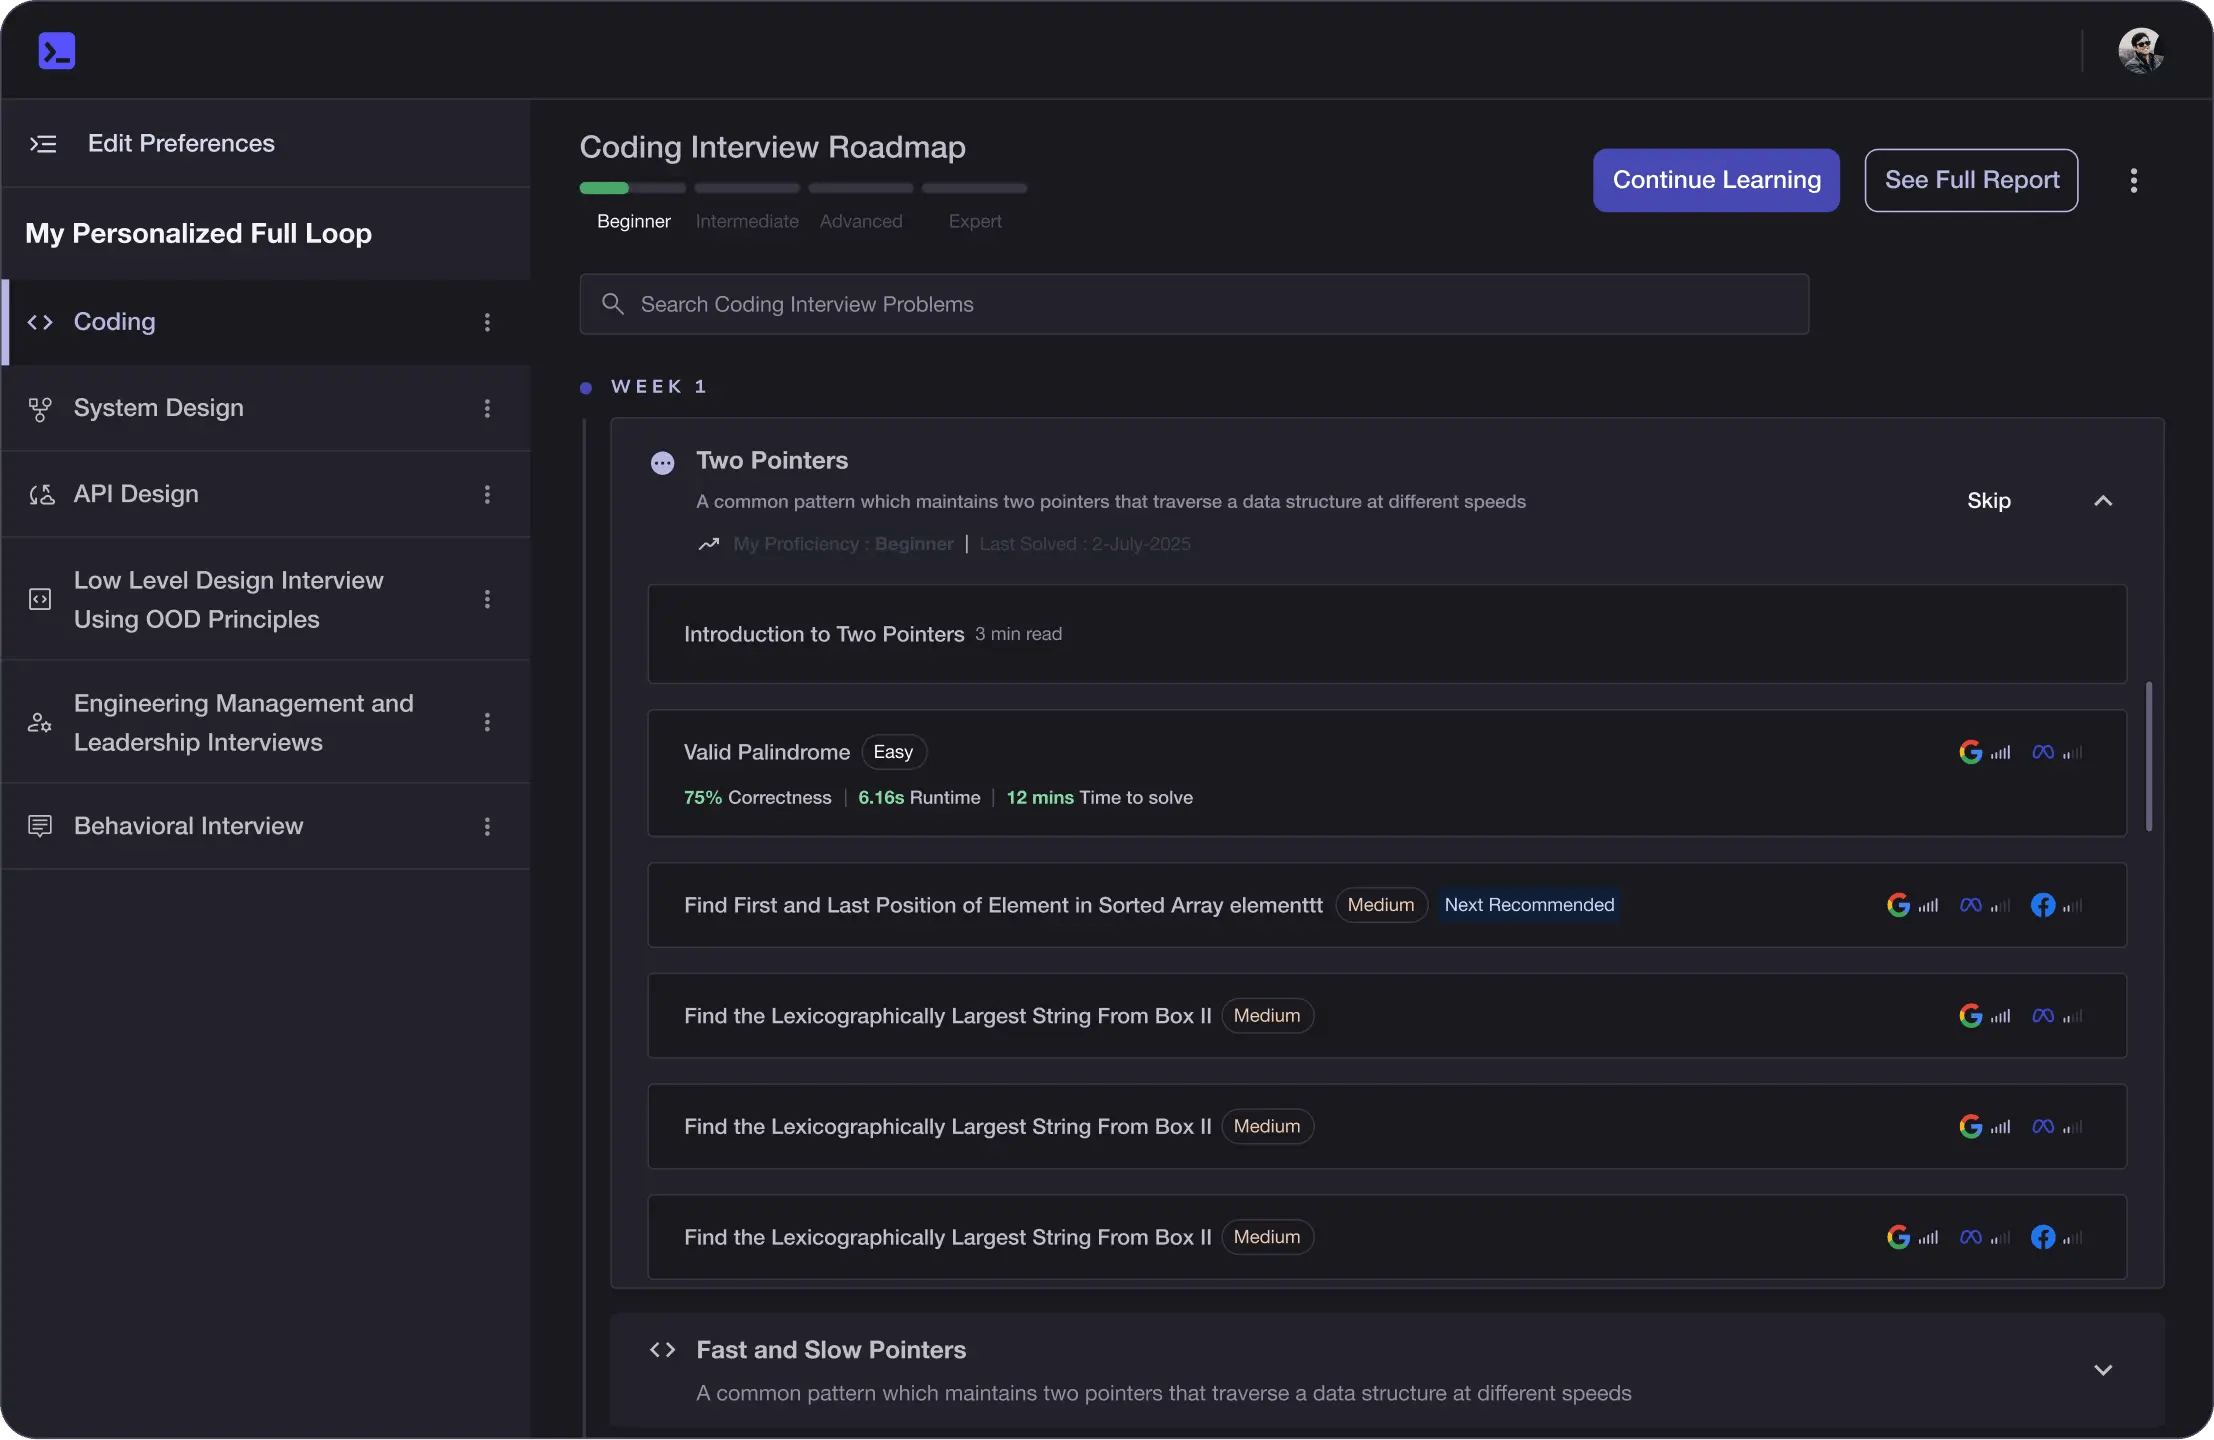
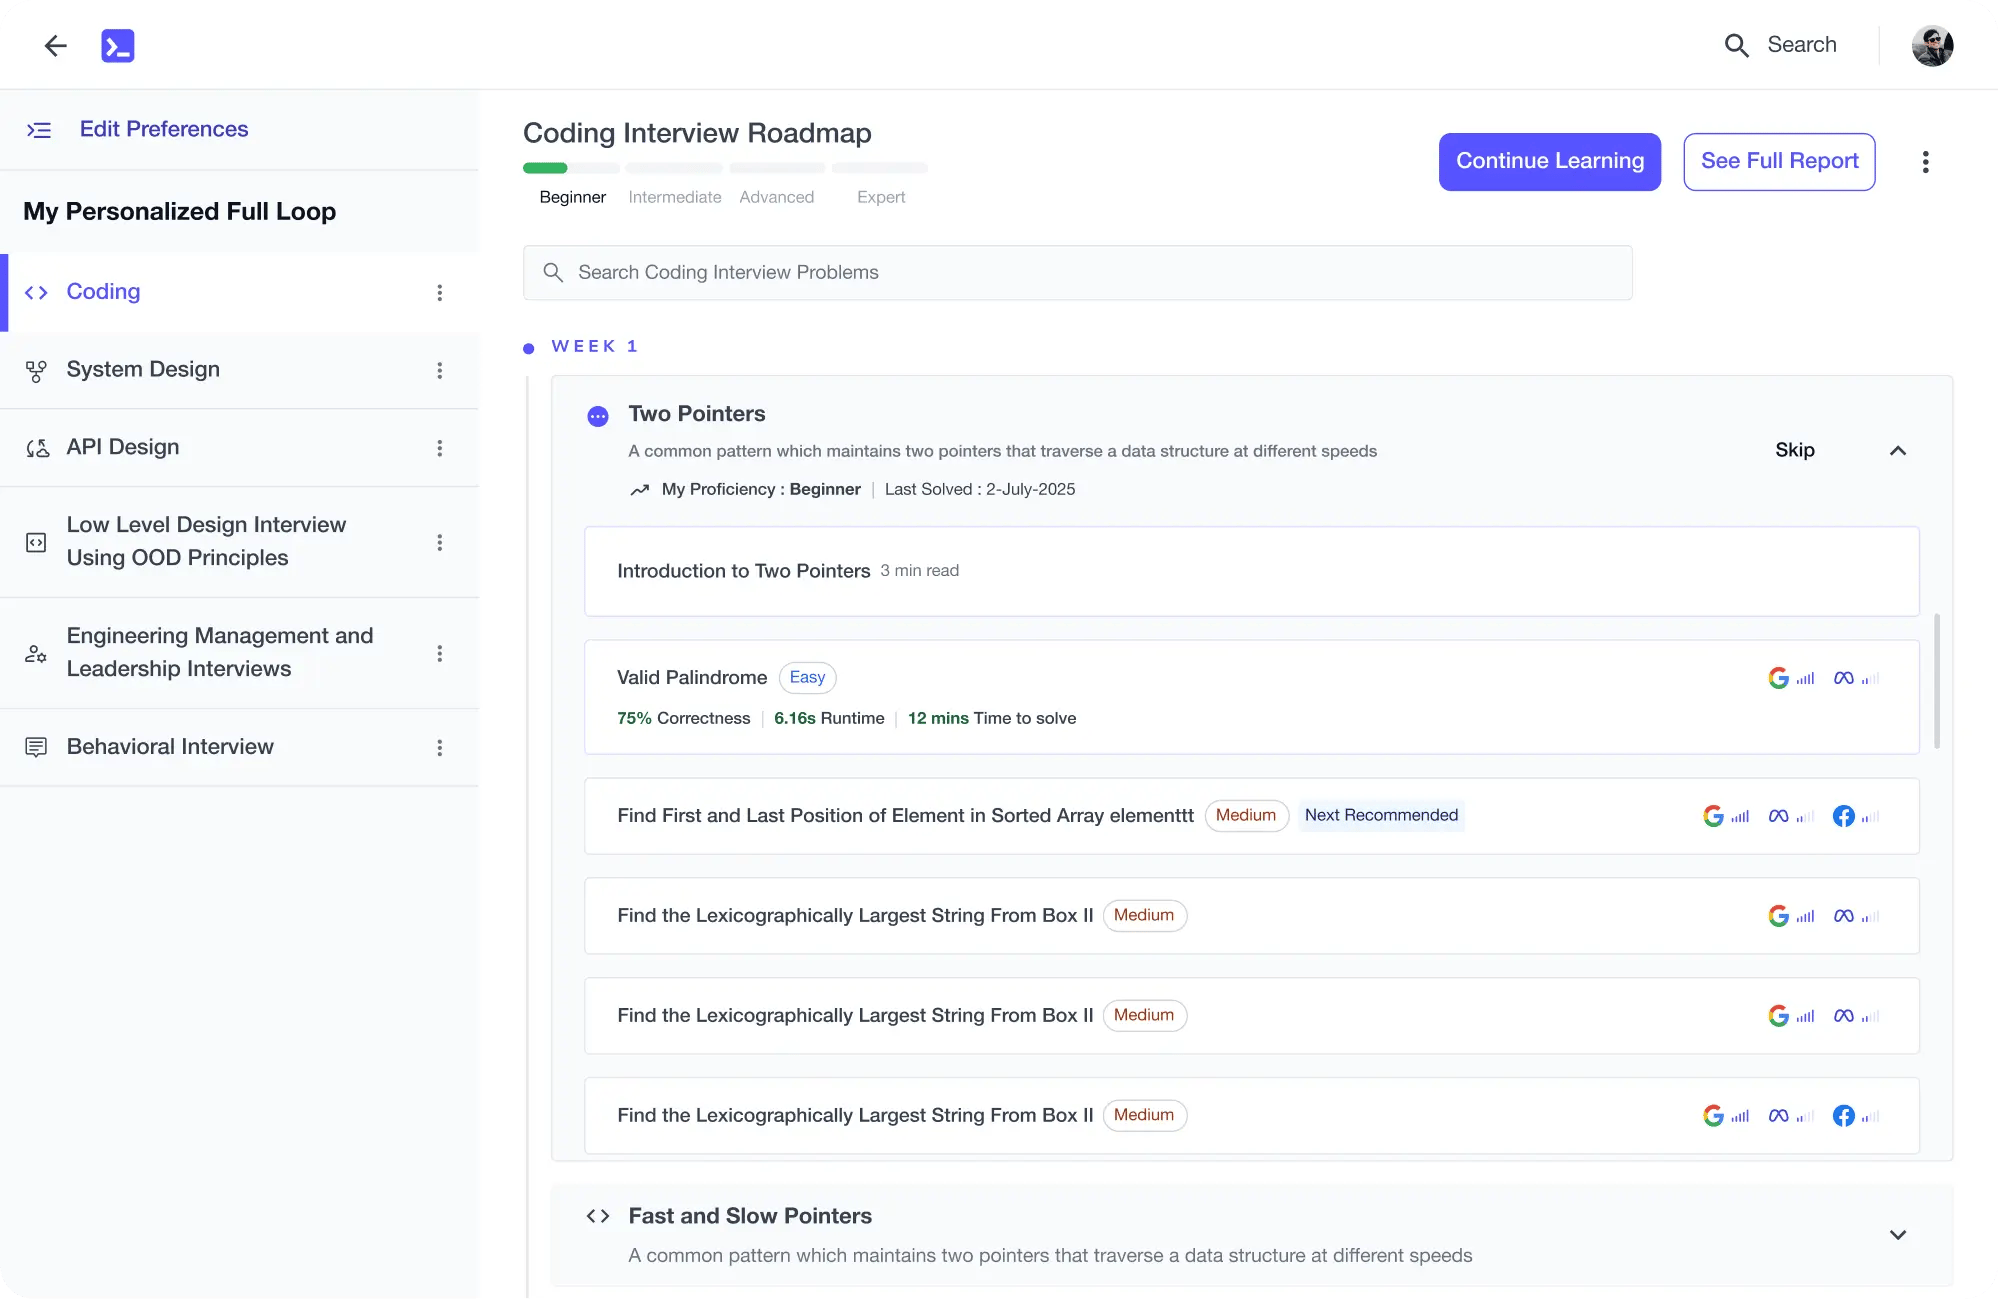
Personalized Roadmaps
The platform adapts to your strengths & skills gaps as you go
Future-proof Your Career
Get hands-on with in-demand skills
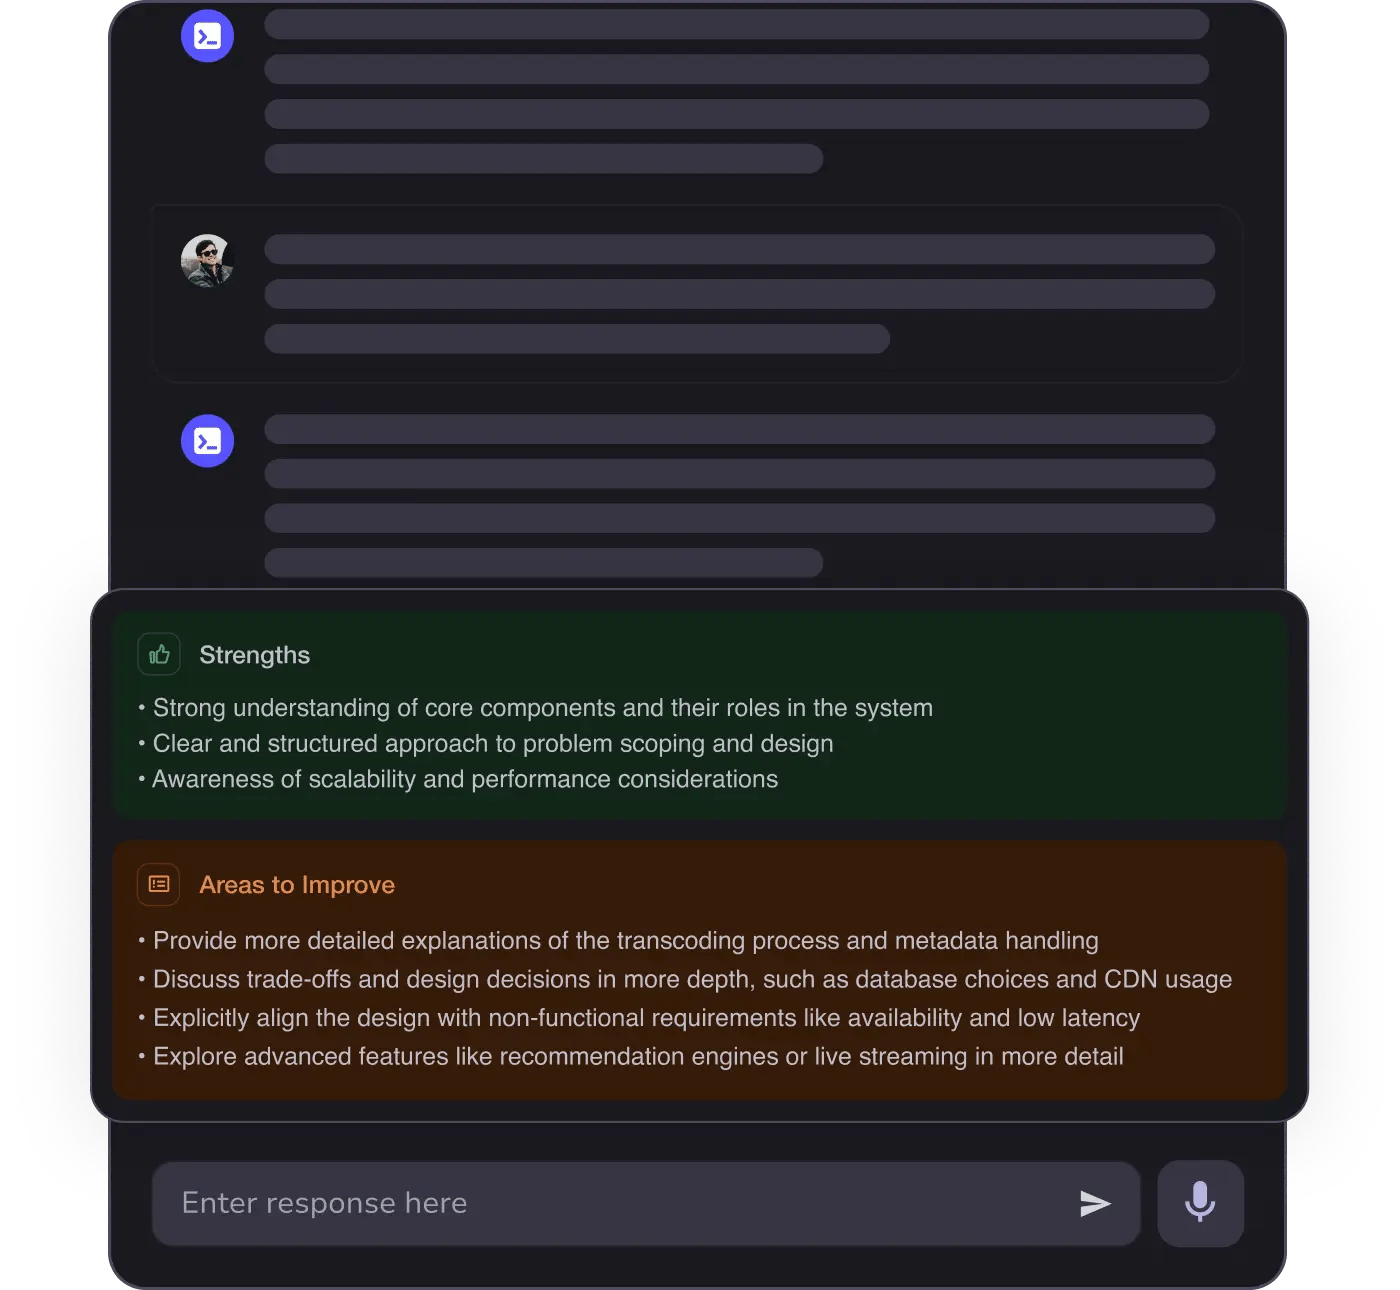
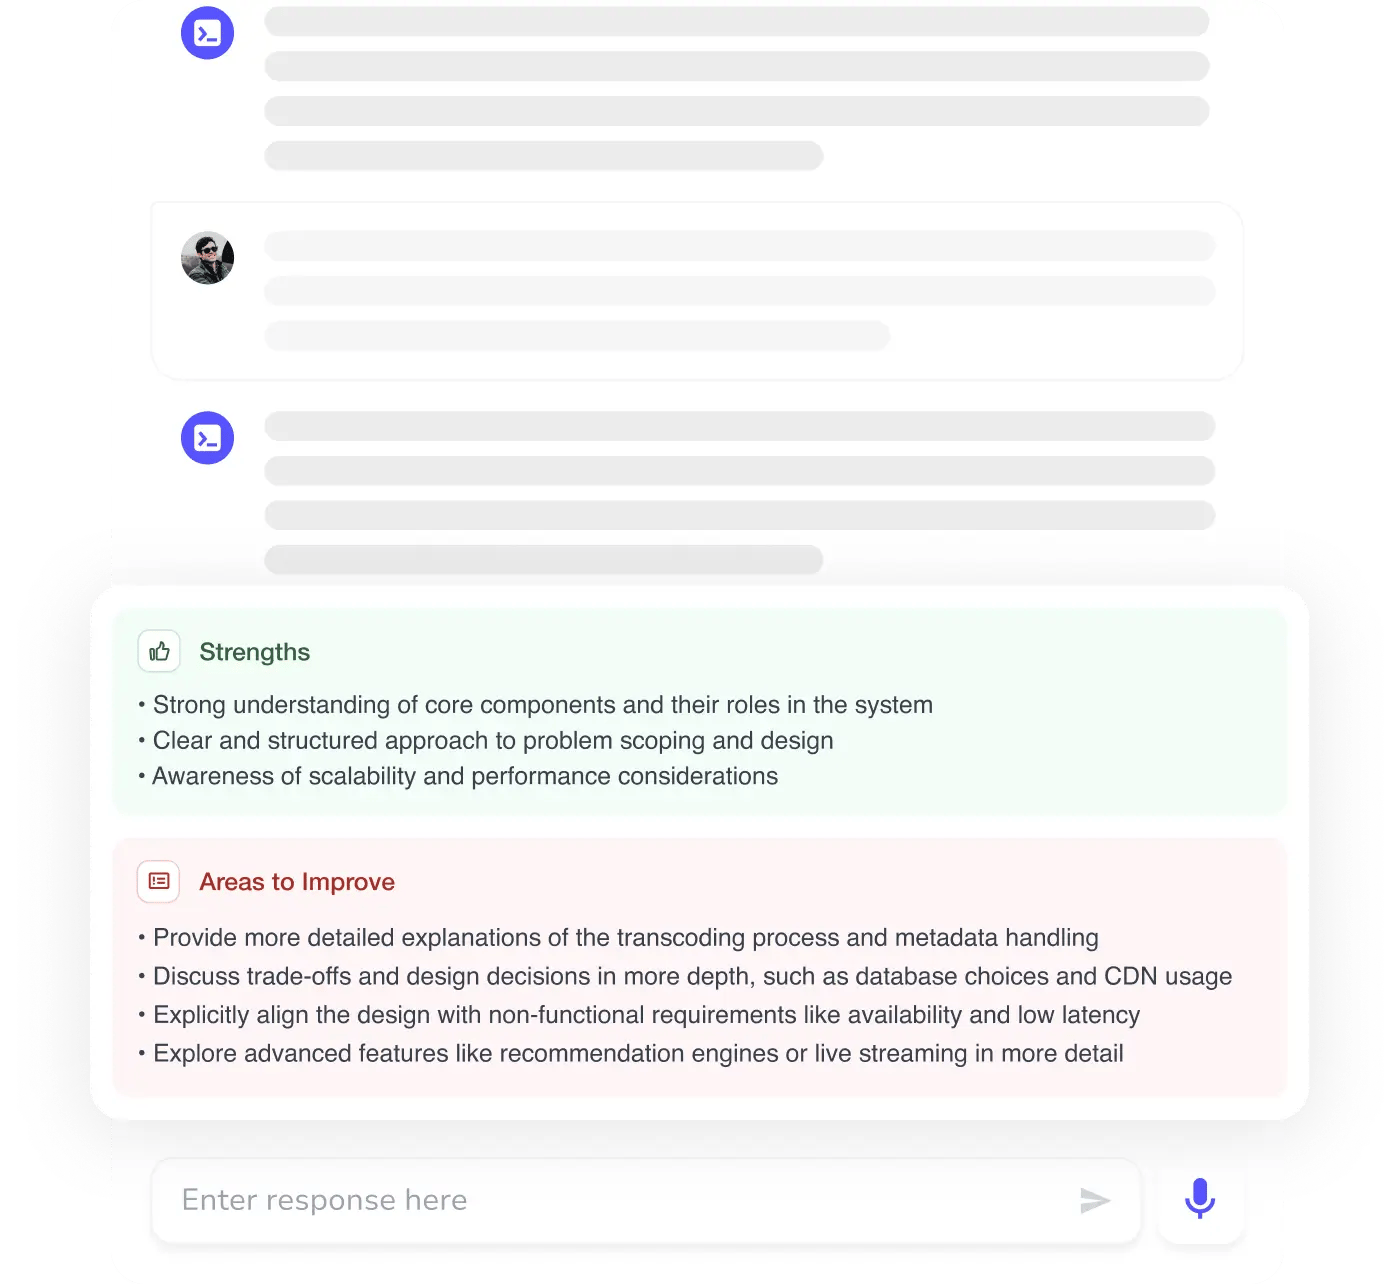
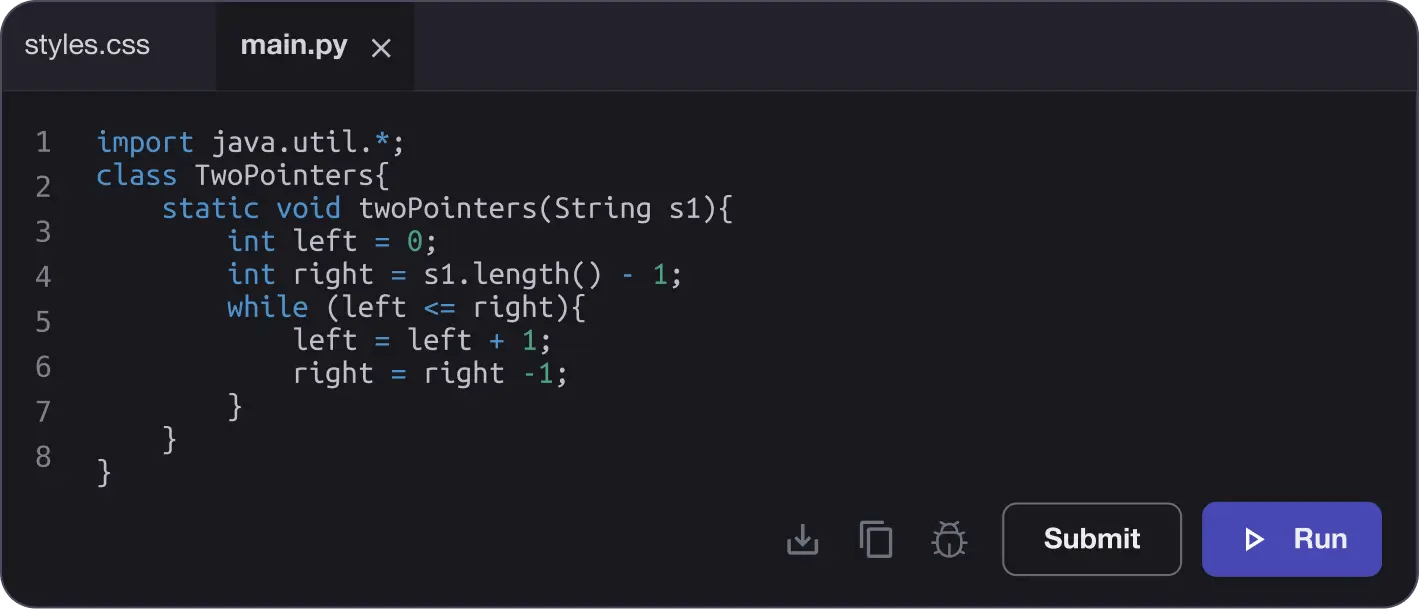
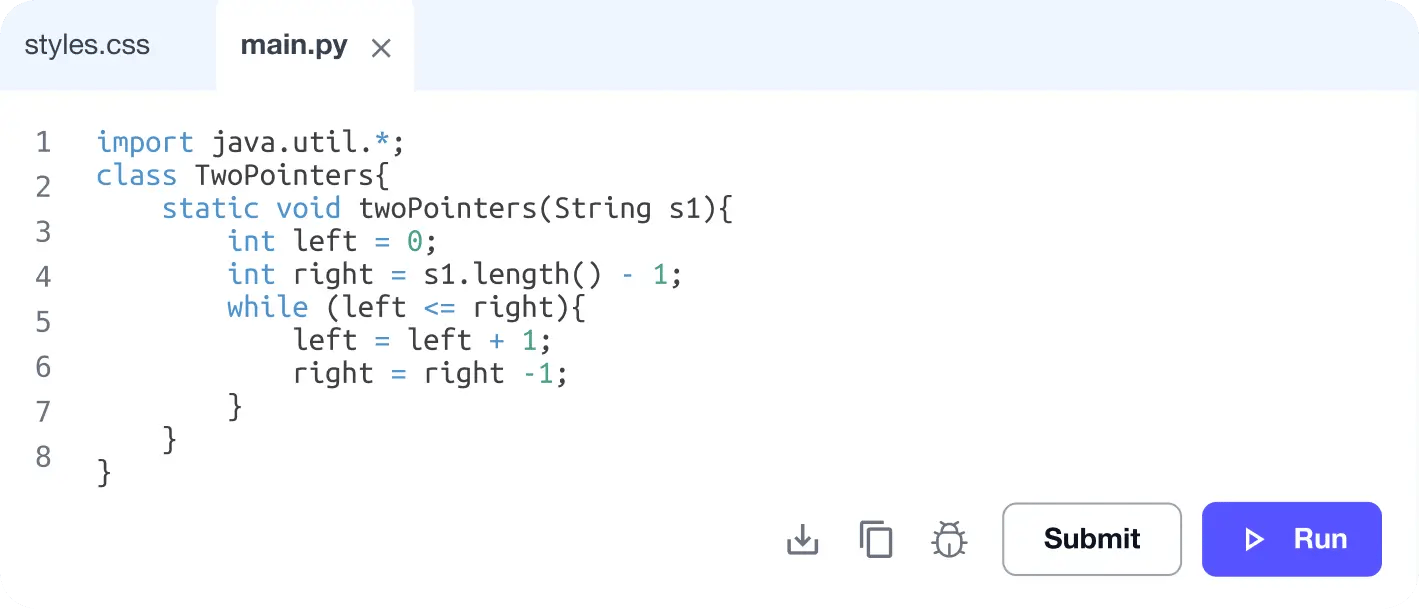
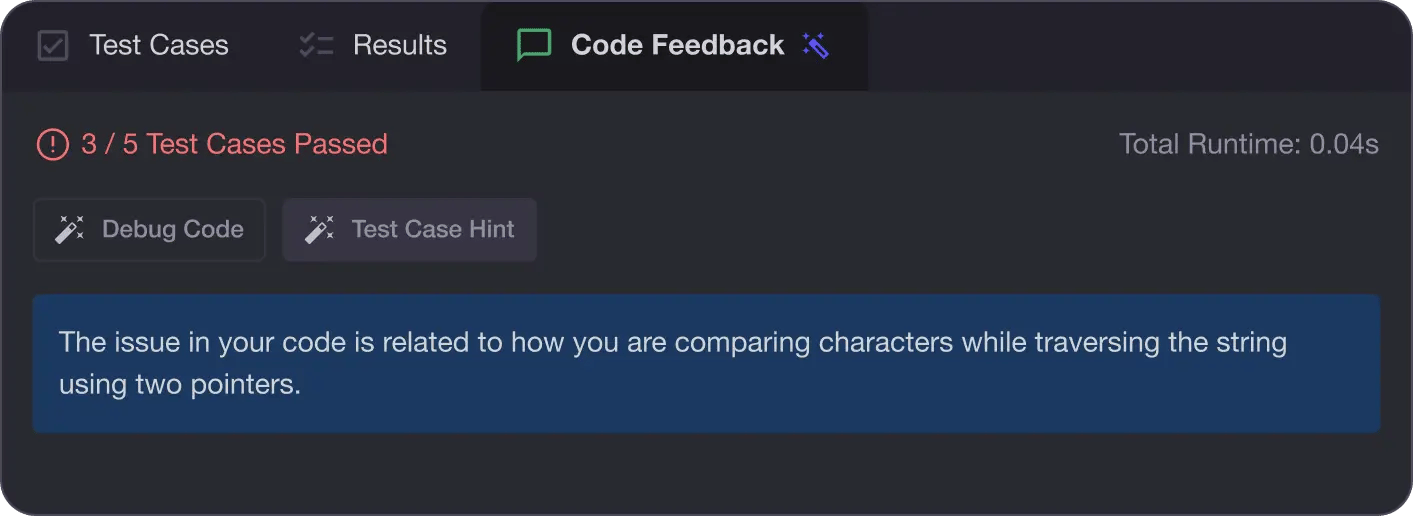
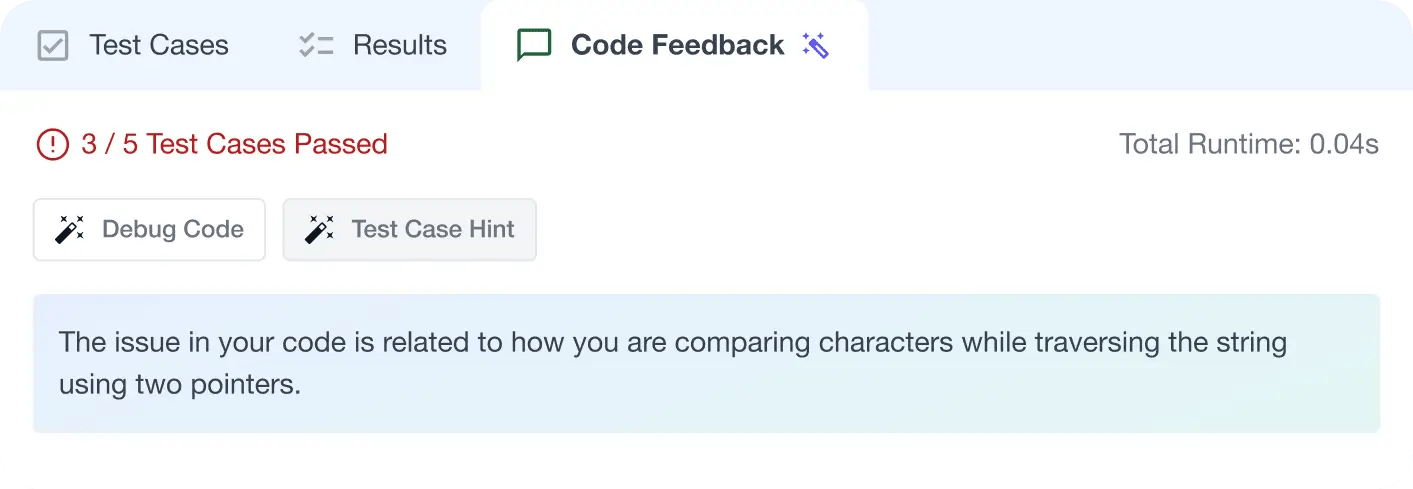
AI Code Mentor
Write better code with AI feedback, smart debugging, and "Ask AI"
MAANG+ Interview Prep
AI Mock Interviews simulate every technical loop at top companies