AI-powered learning
Save this course
D3 Tips and Tricks: Interactive Data Visualization
Gain insights into D3.js, and learn to create and style interactive visuals. Delve into line graphs, bar charts, histograms, and more to master data visualization with D3.
5.0
144 Lessons
102h 30min
Updated 2 months ago
Join 3 million developers at
Join 3 million developers at
LEARNING OBJECTIVES
- Set up a D3 workflow using HTML, CSS, JavaScript, and a web server
- Load and parse CSV/JSON data with promises, d3.timeParse, and numeric conversion
- Build line charts with SVG, margins, scales/domains, axes, labels, and titles
- Customize axes with tick intervals, tick formatting, rotated labels, and gridlines
- Draw and style SVG shapes and paths using attributes, transforms, and CSS rules
- Create bar charts and histograms using scaleBand, scaleLinear, and d3.bin
- Implement interactivity with tooltips, transitions, filtering, and HTML input controls
Learning Roadmap
1.
Introduction
Introduction
Get familiar with essential tools and concepts for beginner-friendly interactive data visualization using D3.js.
2.
Starting with a Simple Graph
Starting with a Simple Graph
Get started with creating simple D3 graphs, integrating HTML, CSS, and JavaScript.
A Simple GraphHTMLCascading Style Sheets (CSS)D3 JavaScriptSetting Up the Margins and the Graph AreaGetting the DataFormatting the Date and TimeSetting Scales, Domains, and RangesAdding Data to the Line FunctionAdding the SVG ElementActually Drawing Something!Challenge: Change X-Axis DisplayChallenge Solution: Change X-Axis DisplayChallenge: Line PropertiesChallenge Solution: Line PropertiesQuiz on Simple Graph ConceptsAuthor's Note
3.
Things We Can Do with the Simple Graph
Things We Can Do with the Simple Graph
21 Lessons
21 Lessons
Work your way through enhancing D3 visualizations by configuring axes, customizing labels, and adding multiple graph features.
4.
Elements, Attributes, and Styles
Elements, Attributes, and Styles
17 Lessons
17 Lessons
Grasp the fundamentals of adding, manipulating, and styling elements in D3.js visualizations.
5.
Bar Charts and Histograms
Bar Charts and Histograms
8 Lessons
8 Lessons
Dig deeper into creating and distinguishing between bar charts and histograms using D3.js.
6.
Tree Diagrams
Tree Diagrams
15 Lessons
15 Lessons
Focus on creating and styling interactive tree diagrams with hierarchical and flat data.
7.
Sankey Diagrams
Sankey Diagrams
9 Lessons
9 Lessons
Master the steps to create and format Sankey diagrams in D3.js, ensuring effective data visualization.
8.
Bullet Charts
Bullet Charts
9 Lessons
9 Lessons
Step through creating and customizing bullet charts using D3.js, with challenges included.
9.
Mapping with D3.js
Mapping with D3.js
9 Lessons
9 Lessons
Unpack the core of geographical data management, map creation, zooming, panning, and interactive challenges.
10.
Assorted Tips and Tricks
Assorted Tips and Tricks
25 Lessons
25 Lessons
Examine tips for tooltips, color gradients, transitions, event handling, filtering, user inputs, and incorporating HTML in D3.js.
11.
D3.js Examples Explained
D3.js Examples Explained
11 Lessons
11 Lessons
Enhance your skills in creating interactive multi-line and difference charts with D3.js.
Certificate of Completion
Showcase your accomplishment by sharing your certificate of completion.
Complete more lessons to unlock your certificate
Developed by MAANG Engineers
ABOUT THIS COURSE
In this course you will explore D3.js, a JavaScript library used for data visualization.
You will start your journey into D3 with a simple line graph. You will learn to break the example down into its components and create variations of the graph by individually tinkering with each component.
You will then dive into how to draw elements in D3, such as geometric shapes and paths. In addition, you will learn to apply various styles to these elements and adjust their attributes. Towards the back half, you will get hands-on experience using the techniques to visualize bar charts, histograms, and tree diagrams, and more.
By the end of this course, you will become a D3 ninja!
ABOUT THE AUTHOR
Malcolm Maclean
I am a technologist that enjoys learning, discovery and passing on information.
Trusted by 3 million developers working at companies
A
Anthony Walker
@_webarchitect_
E
Evan Dunbar
ML Engineer
S
Software Developer
Carlos Matias La Borde
S
Souvik Kundu
Front-end Developer
V
Vinay Krishnaiah
Software Developer
Built for 10x Developers
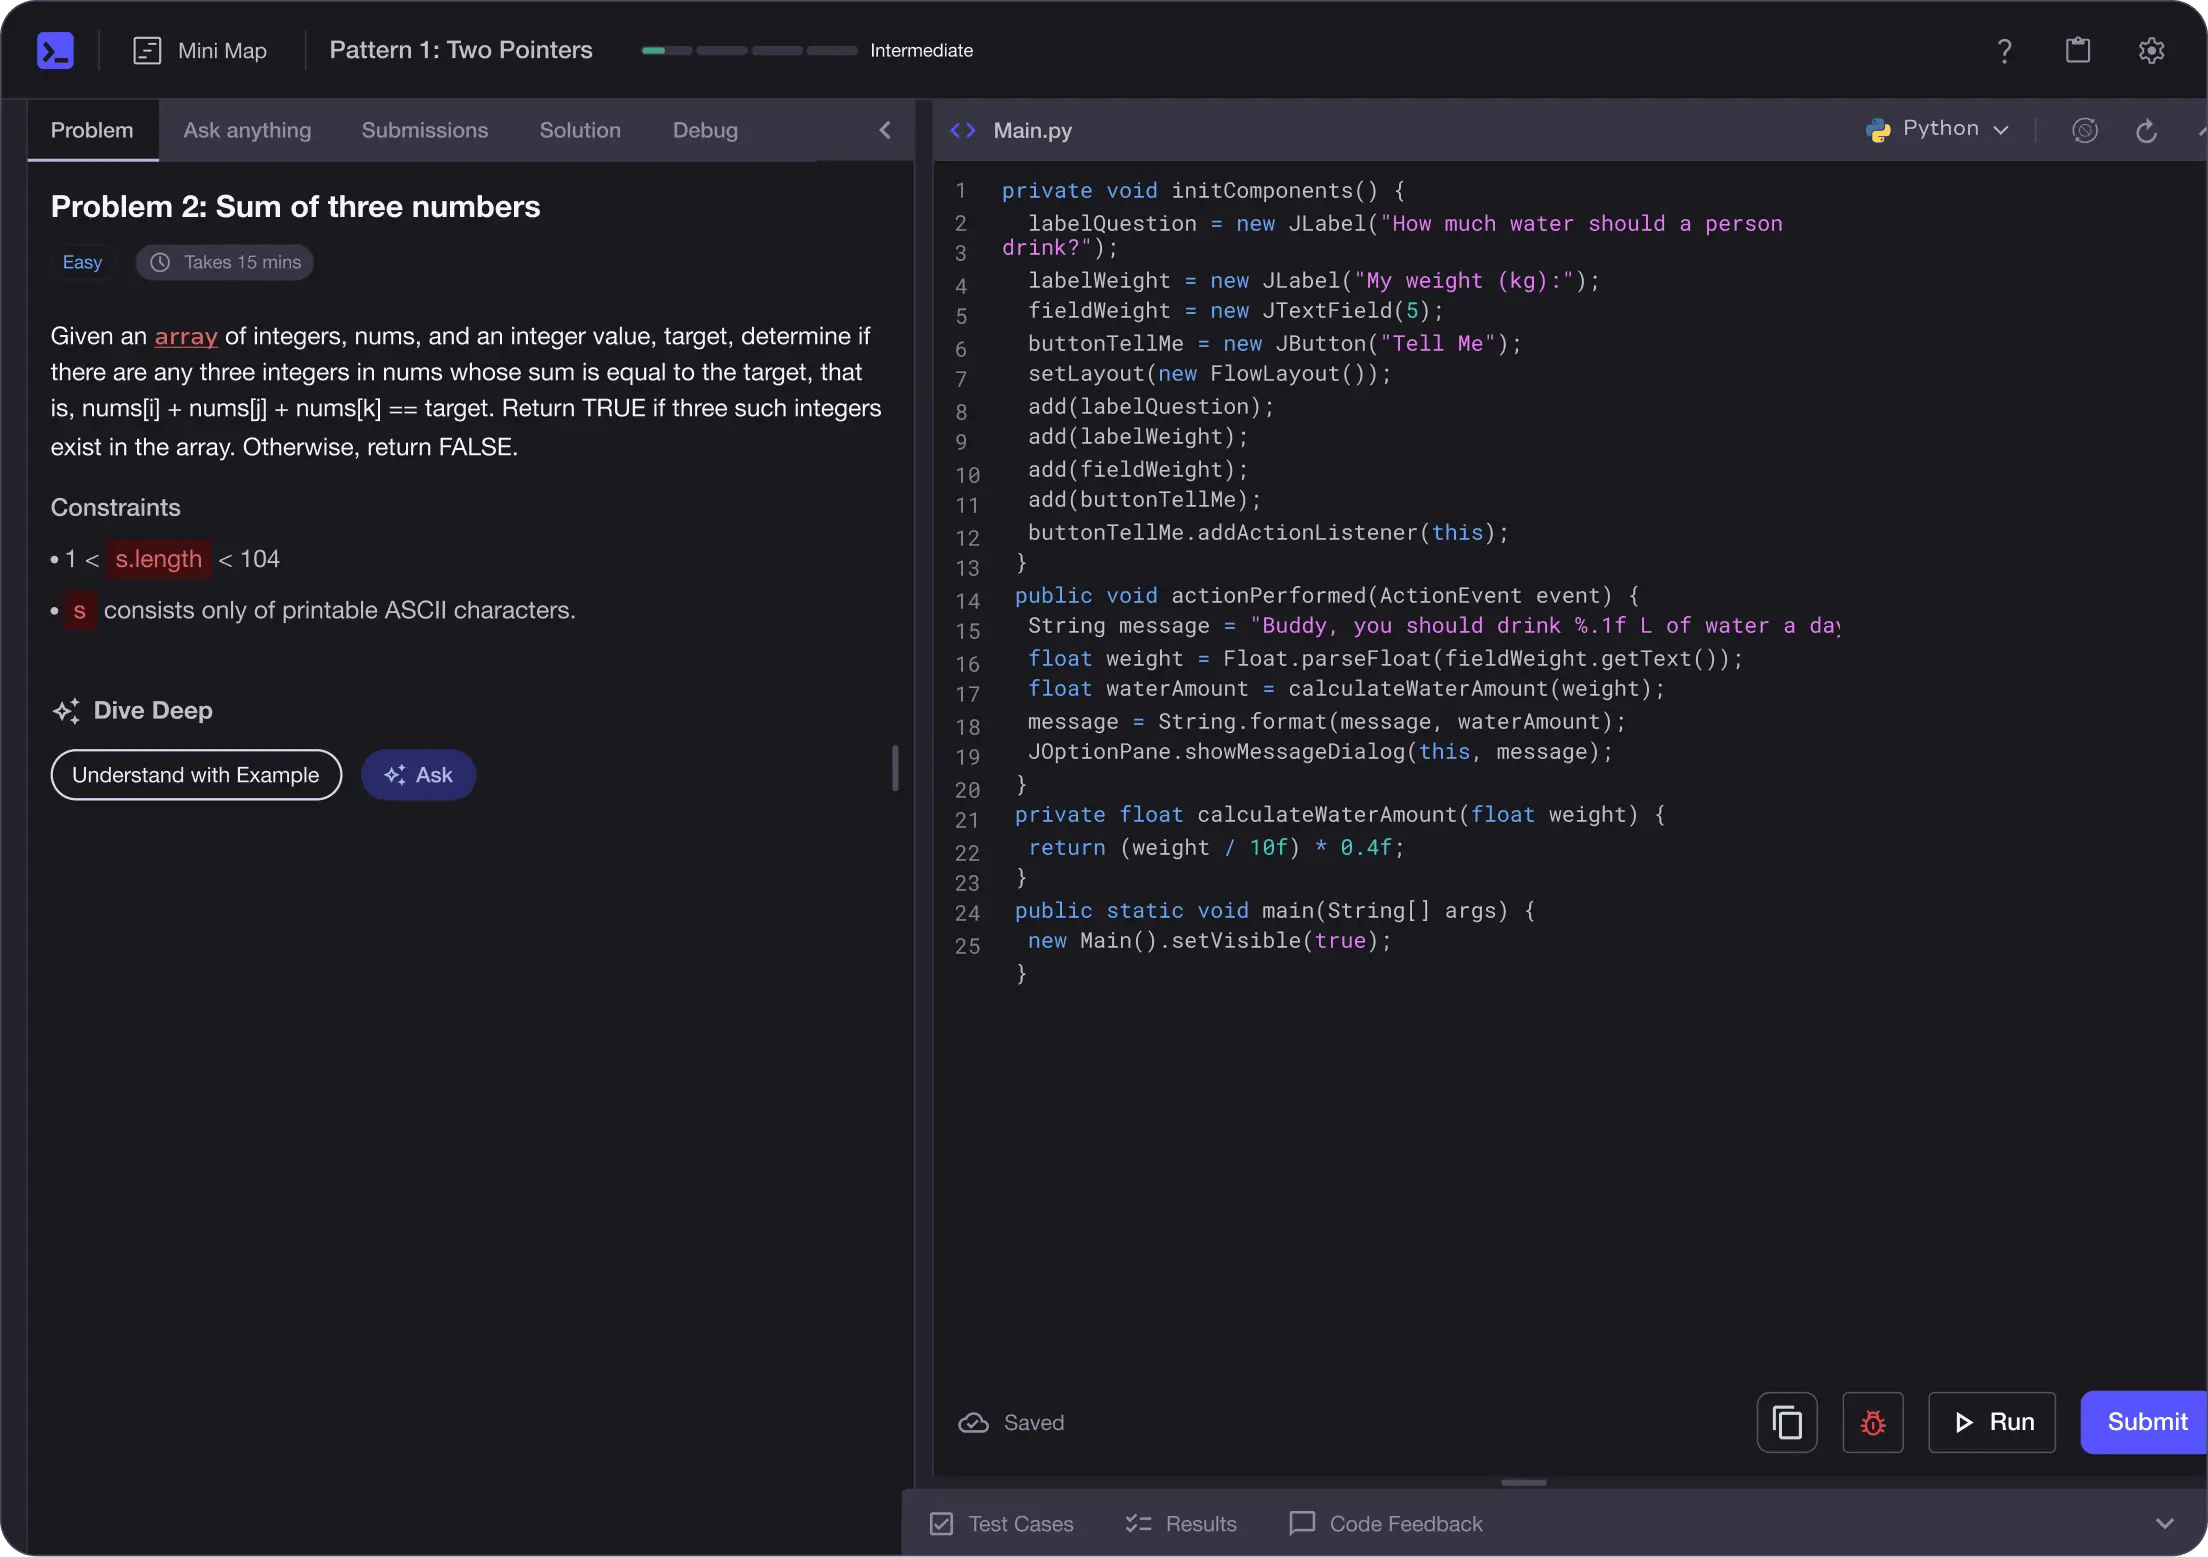
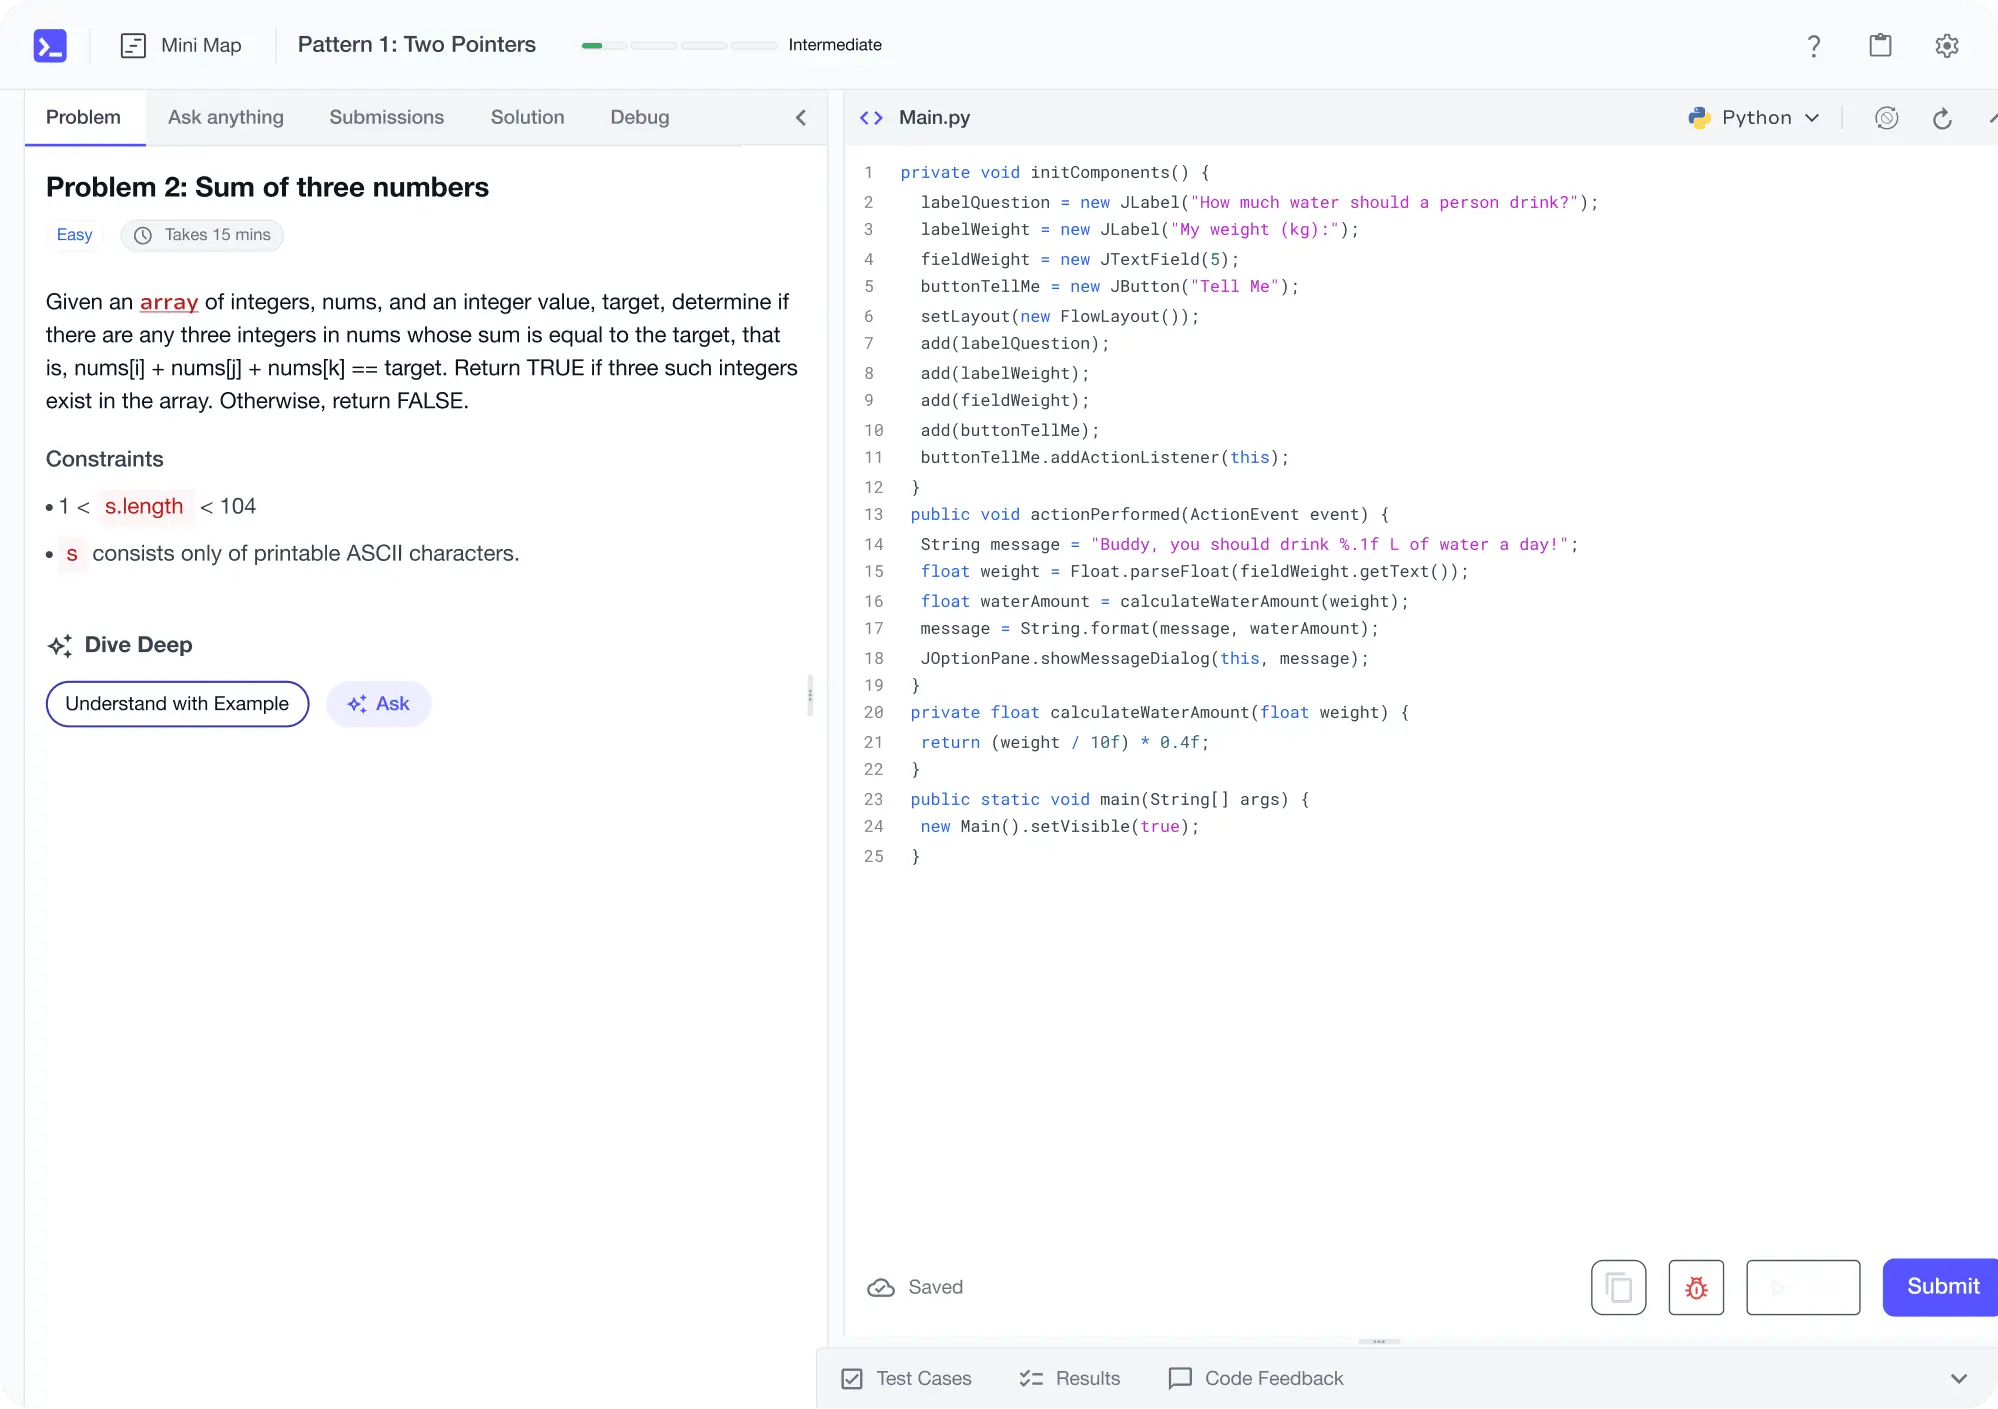
No Passive Learning
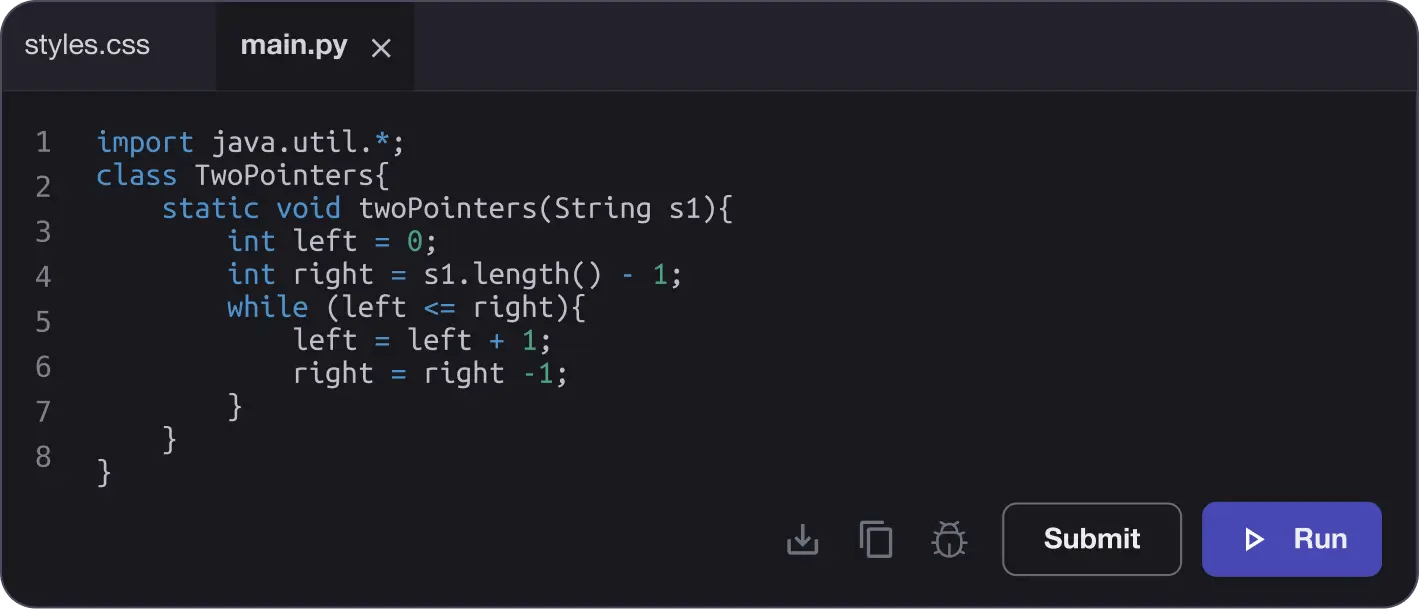
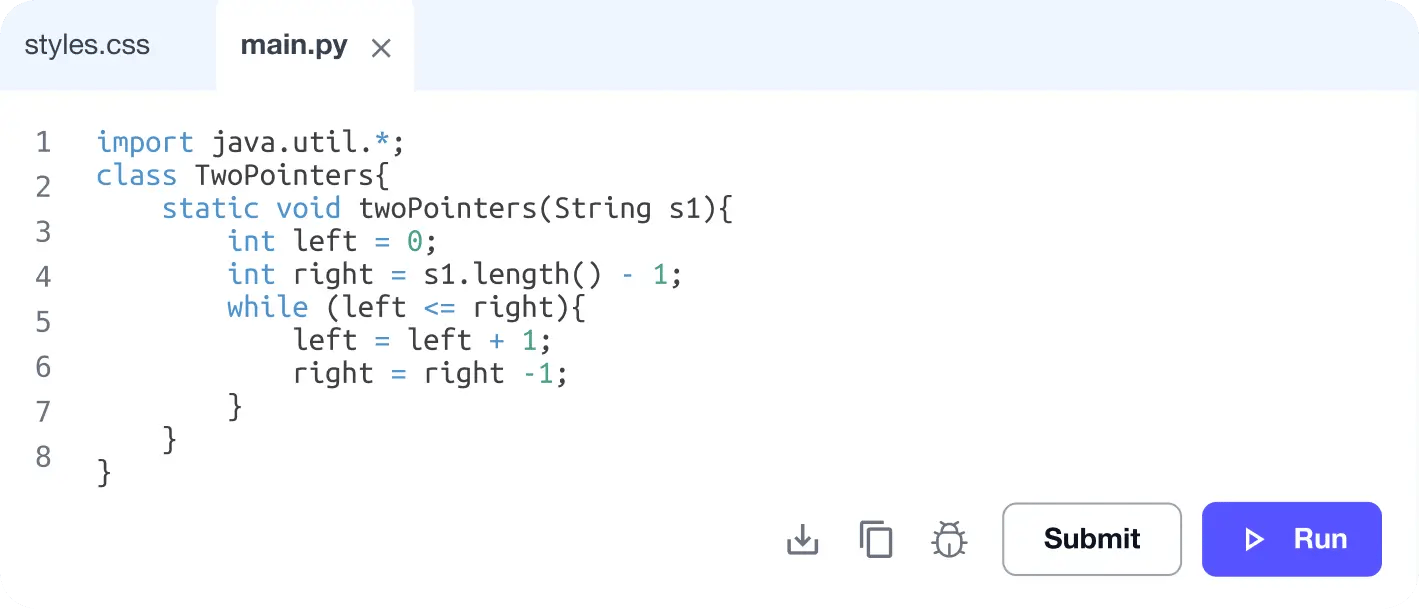
Learn by building with project-based lessons and in-browser code editor
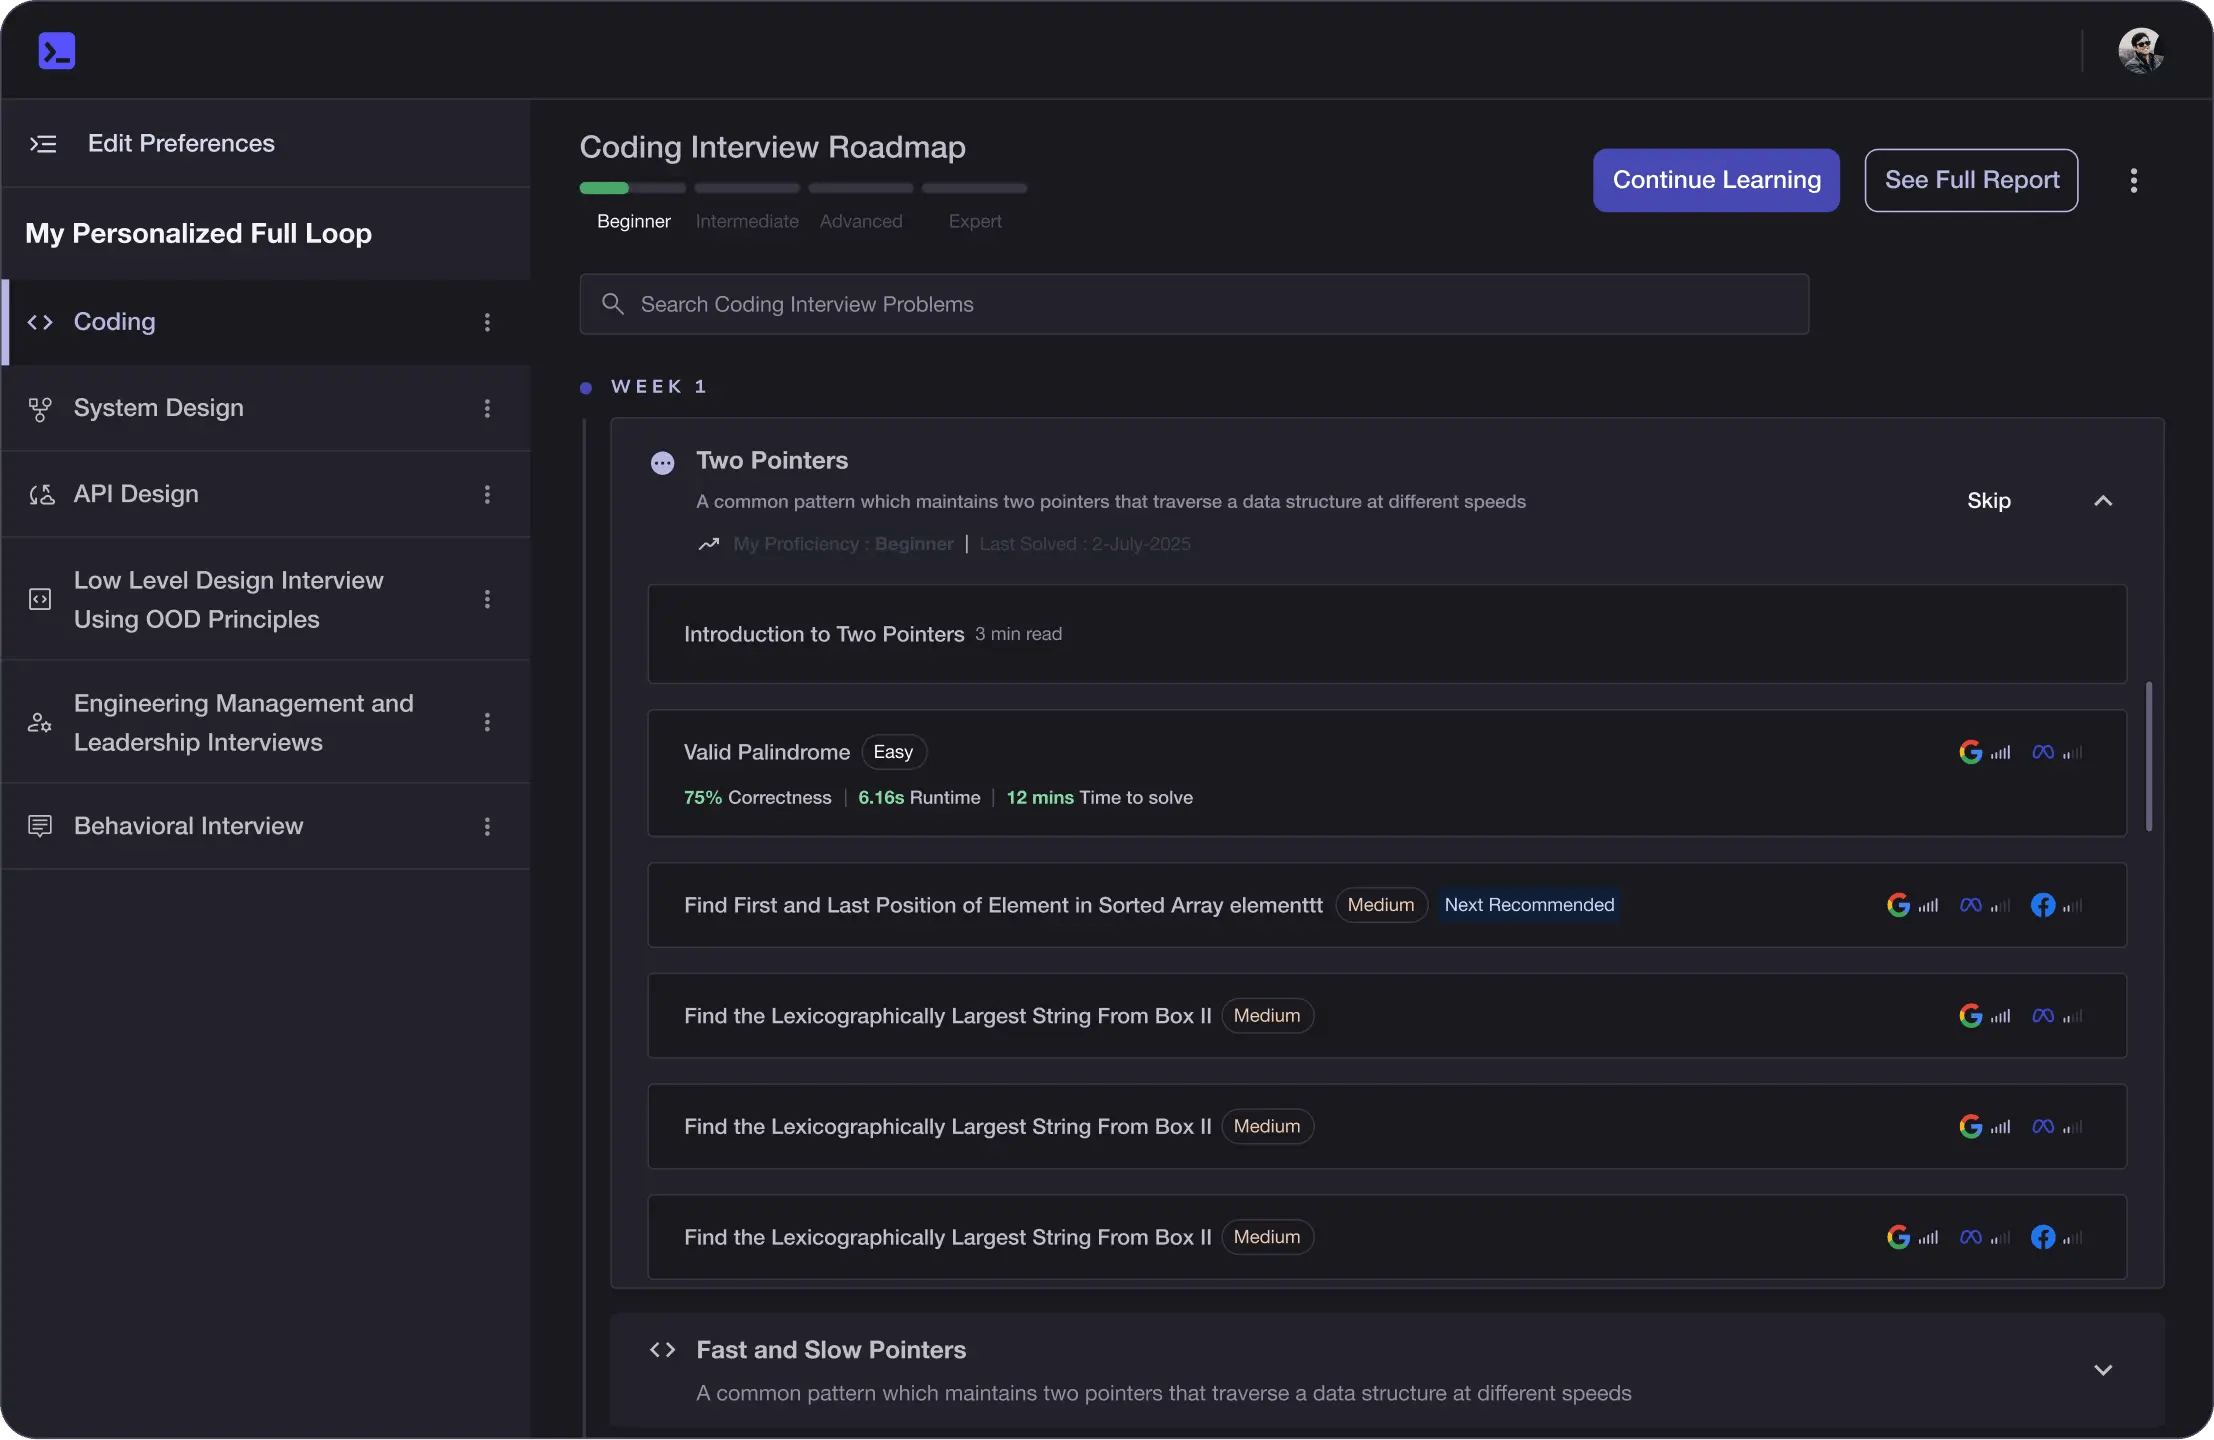
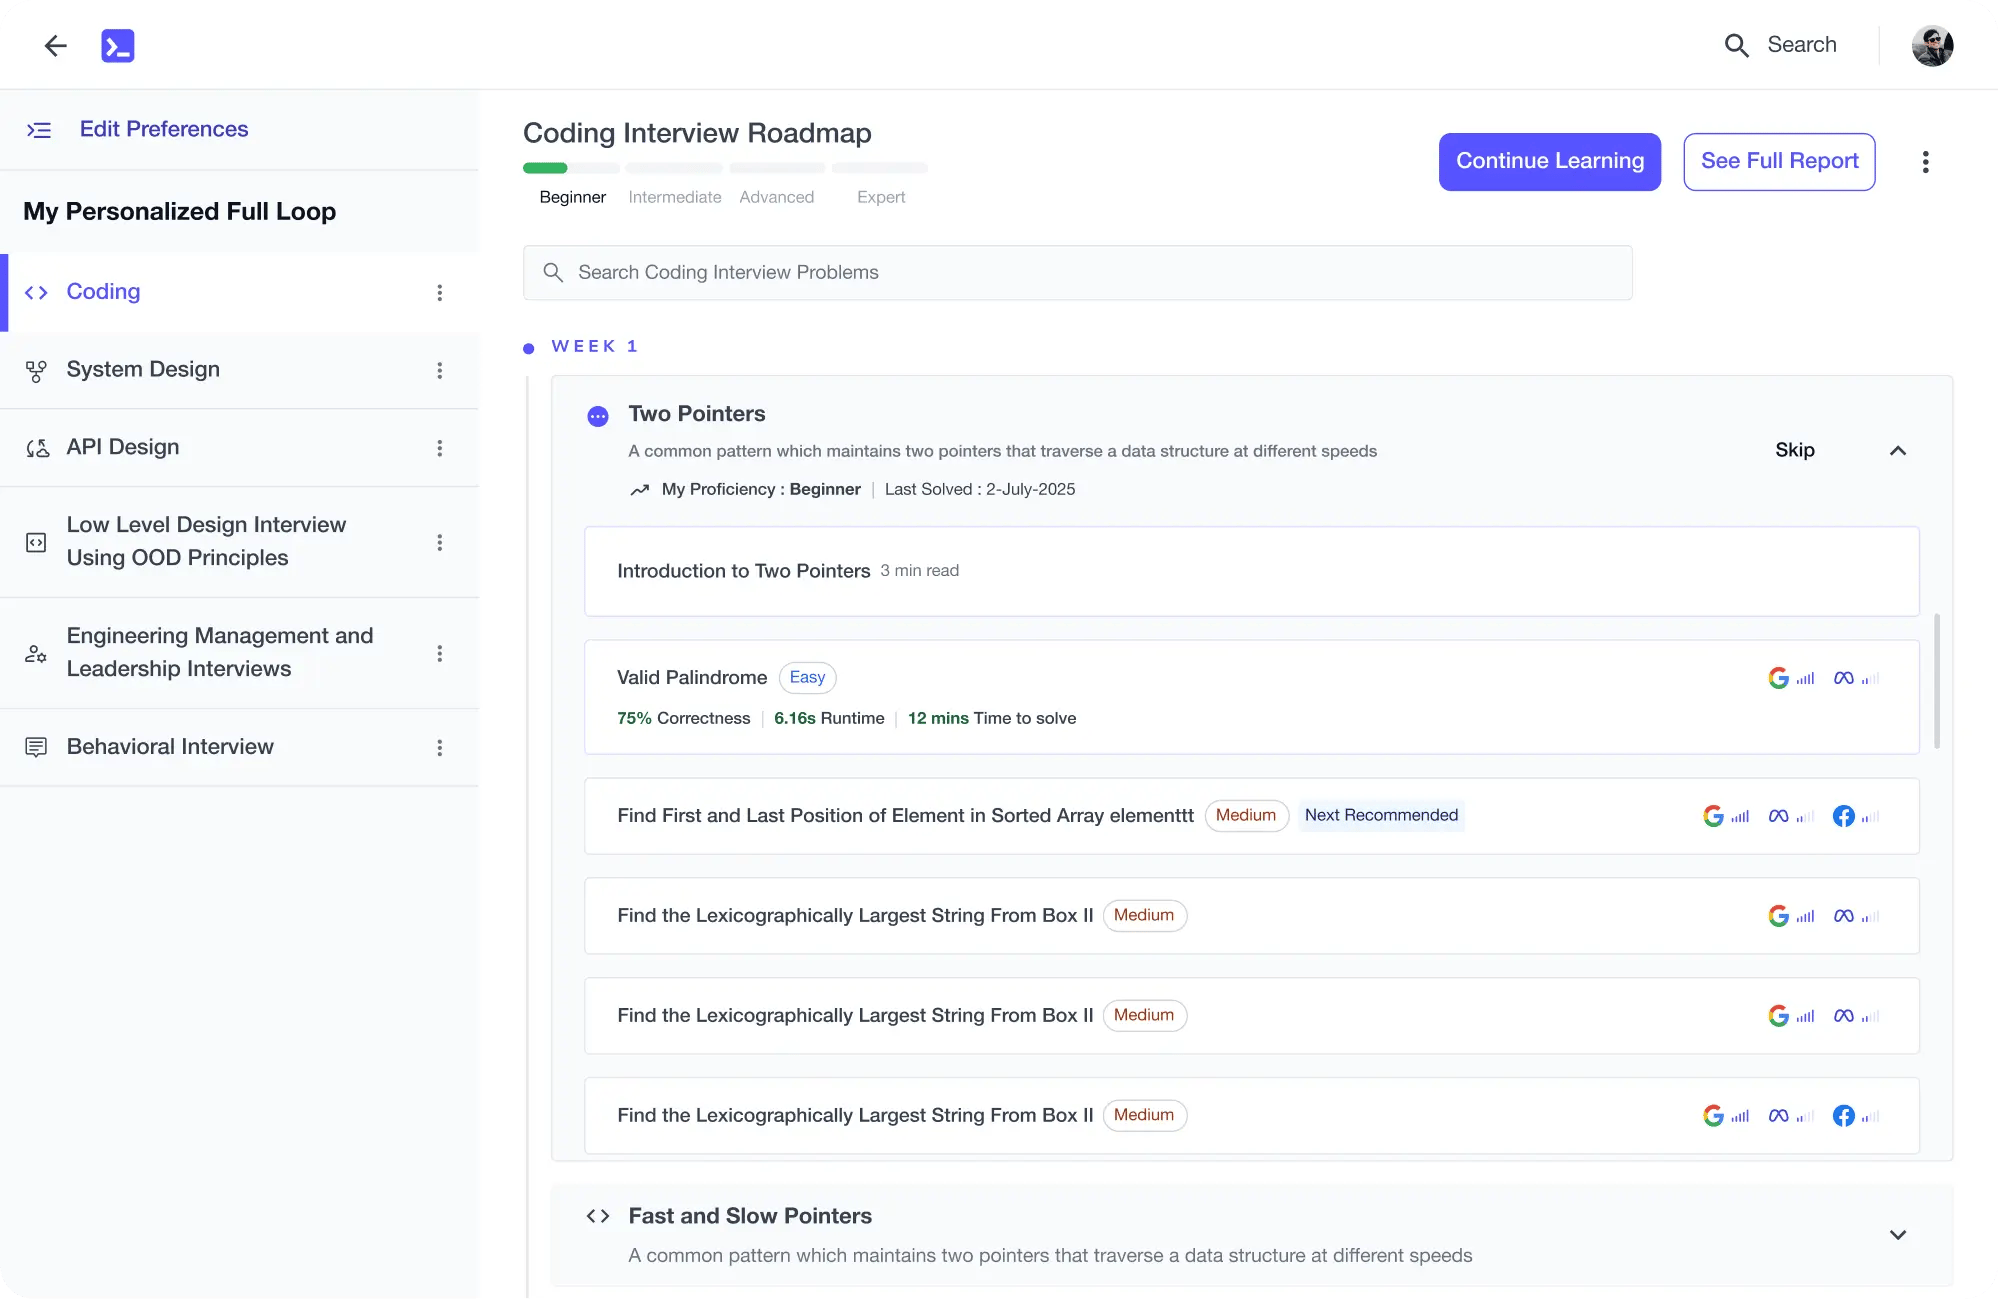
Personalized Roadmaps
The platform adapts to your strengths & skills gaps as you go
Future-proof Your Career
Get hands-on with in-demand skills
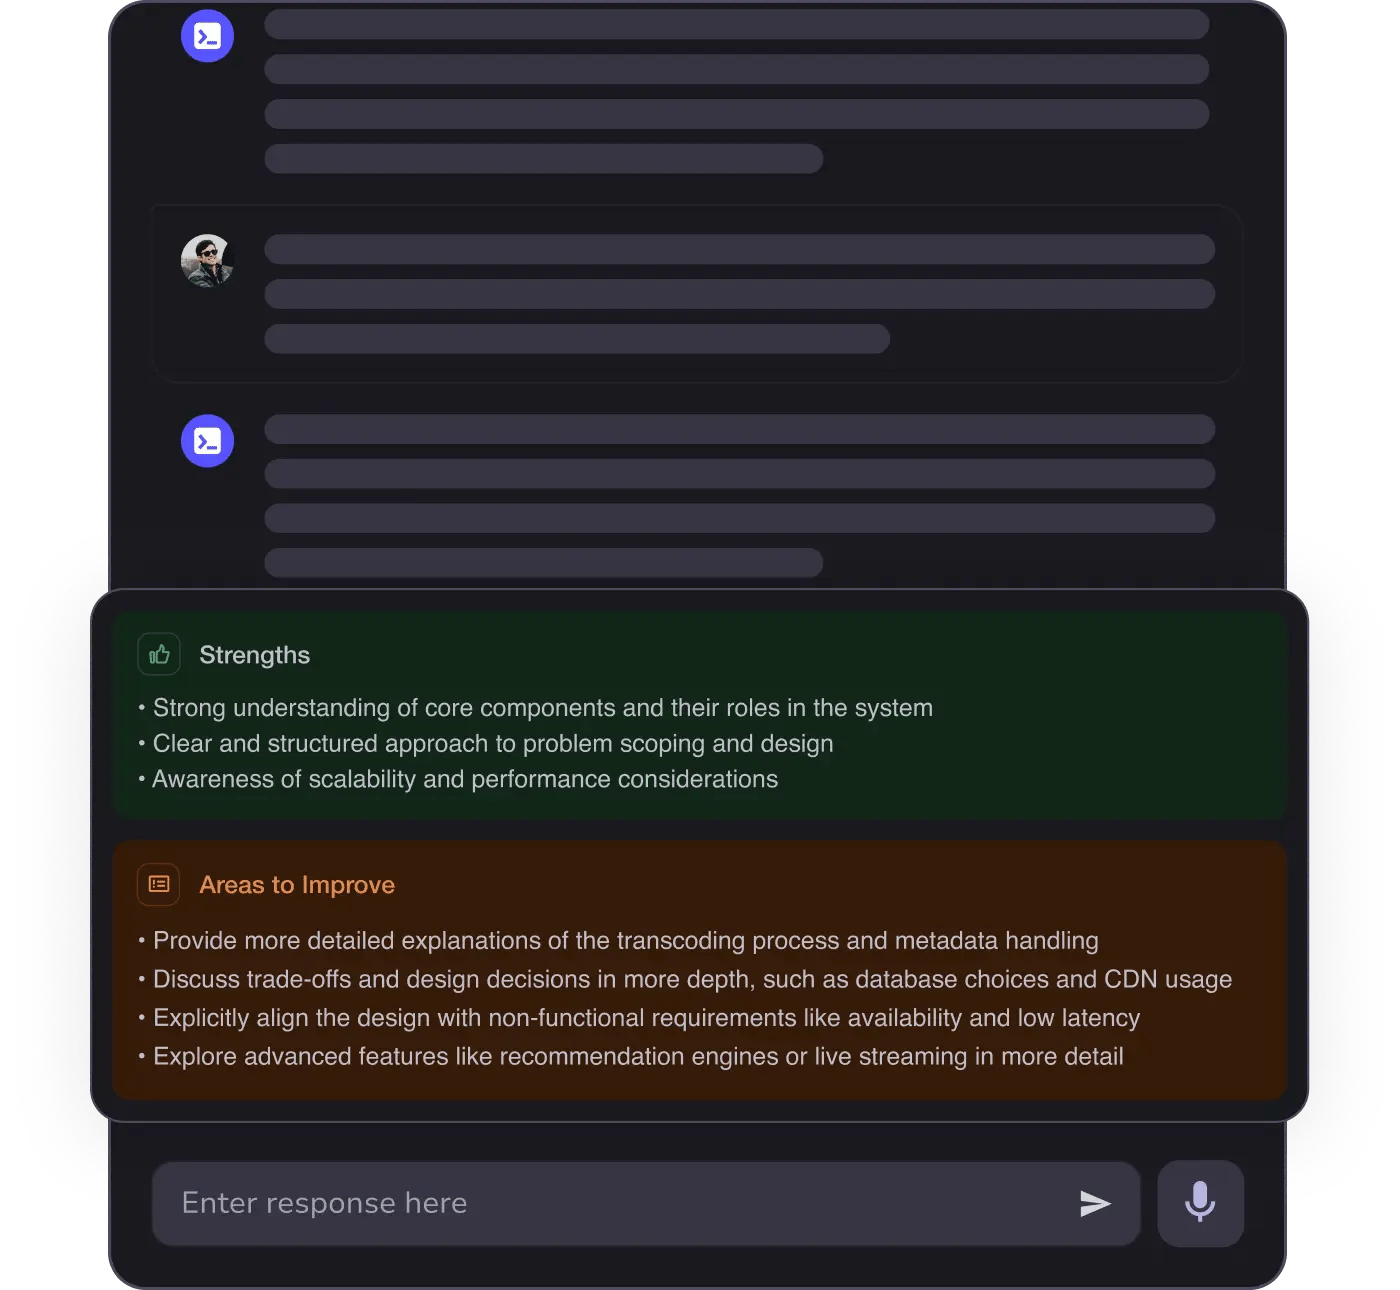
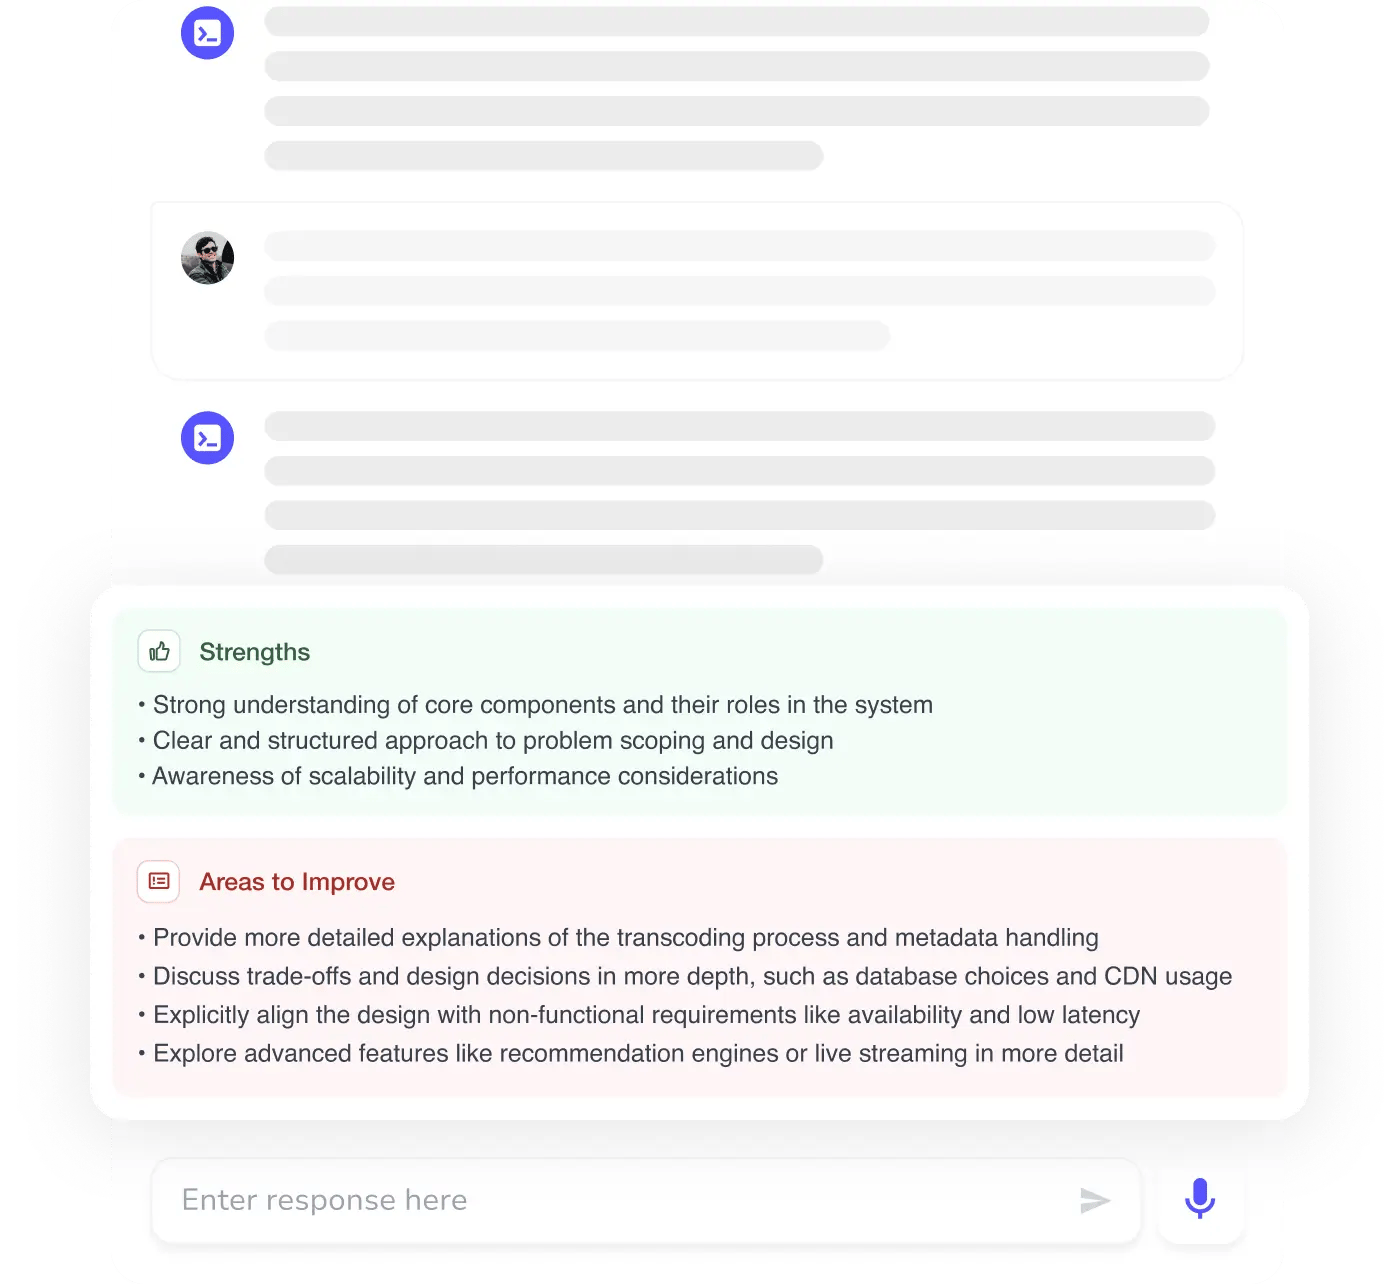
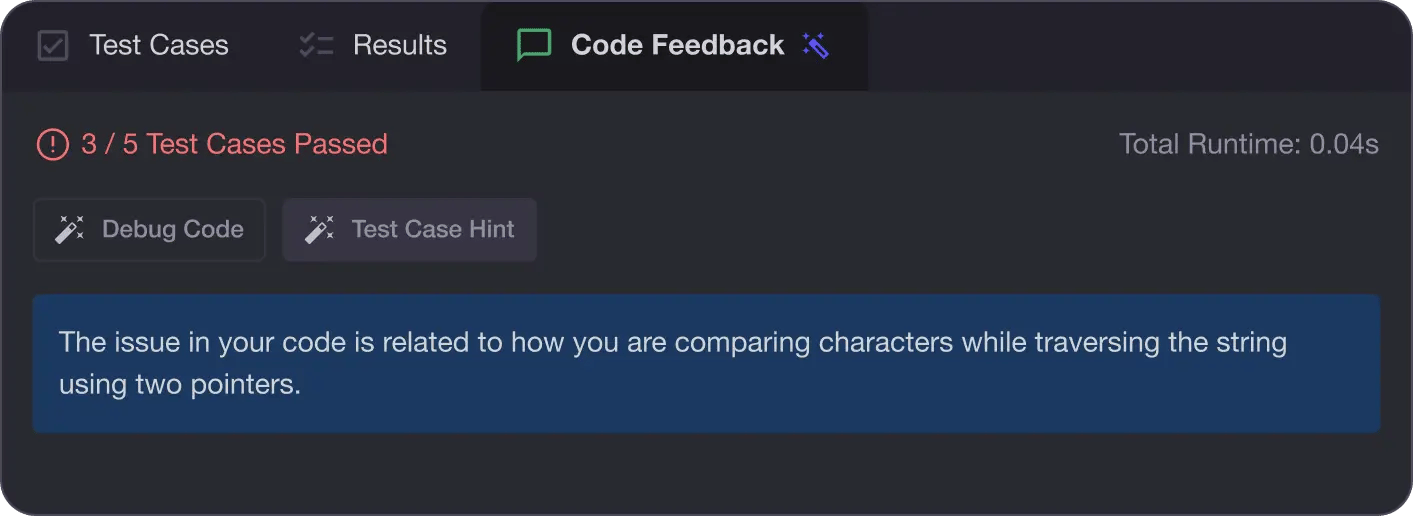
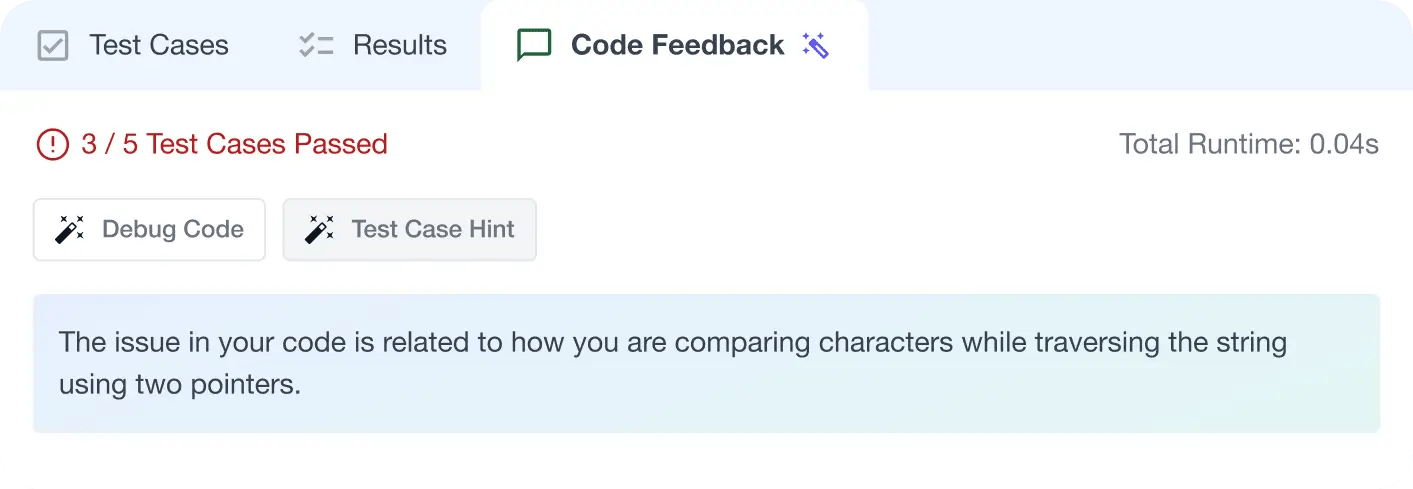
AI Code Mentor
Write better code with AI feedback, smart debugging, and "Ask AI"
MAANG+ Interview Prep
AI Mock Interviews simulate every technical loop at top companies